
Homework Answers
Taking natural logarithm to both sides of the equation we get


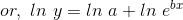

where z = ln y and c = ln a
| x | y | z = lny |
| 2 | 12 | 2.485 |
| 4 | 34 | 3.526 |
| 6 | 102 | 4.625 |
| 8 | 256 | 5.545 |
| 10 | 727 | 6.589 |
| 12 | 1877 | 7.537 |
In our case, we have N = 6 datasets. Using standard equations, the value of b and c can be determined as follows

Using Excel to calculate the terms in this equation, we get


Putting these values in the equation we get


Using this the value of c can be caluclated as


Thus the linear fit is

From our prvious assumption,


Thus the exponential equation fit to the data is

In the subsequent steps I have used Excel for the calculations to avoid human error. All formulae used are written in the headings.

For the calculation of the R^2 value we will use the linear fit data
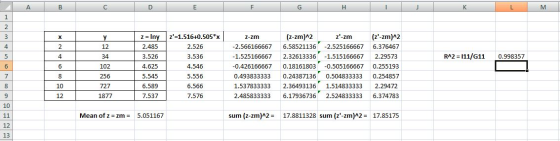
Thus from here we get
- Standard deviation of the data is 34.02
- The standard estimate of error is 13.89
- The value of
 is 0.998
 is 0.998
*A humble request* - If you have any doubt, please use the comment section to communicate. Please be a little patient, it is an honest promise I will reply as soon as possible. This will clarify your doubt, and also help me to get better at answering your next questions. At the same time, If my answer helped you, please consider leaving an upvote. I hope you understand my viewpoint. Thank you :)
Add Answer to:
Problem 2 The following data can be well-represented by an equation of the form: Y =...
Consider the following information regarding a response variable y and an explanatory variable x. x⎯⎯=8∑(xi−x⎯⎯)2=696 ∑(xi−x⎯⎯)(yi−y⎯⎯)=−346x¯=8∑xi-x¯2=696...
Consider the following information regarding a response variable y and an explanatory variable x. x⎯⎯=8∑(xi−x⎯⎯)2=696 ∑(xi−x⎯⎯)(yi−y⎯⎯)=−346x¯=8∑xi-x¯2=696 ∑xi-x¯yi-y¯=-346 y⎯⎯=8Σ(yi−y⎯⎯)2=185Σ(yi−yˆ)2=13n=25y¯= 8 Σ(yi− y¯)2 = 185 Σ(yi− y^)2=13n= 25 a. Calculate b0 and b1.b. What is the sample regression equation? Predict y if x equals 10. c. Calculate the standard error of the estimate. d. Calculate and interpret the coefficient of determination.
5. Consider the following data (You are allowed to use built-in function in R, but the...
 5. Consider the following data (You are allowed to use built-in function in R, but the code must be attached) X 99.0 101.1 102.7 103.0 105.4 107.0 108.7 110.8 112.1 112.4 113.6 113.8 115.1 115.4 120.0 y 28.8 27.9 27.0 25.2 22.8 21.5 20.9 19.6 17.1 18.9 16.0 16.7 13.0 13.6 10.8 (a) Obtain sample statistics such as sample mean of y and x and swa = n. 2-1(;- T)?, Say = n-1 =1(xi – 7)(yi – ). (b) Obtain...
please solve using matlab 4. Nonlinear Regression Fit the below data with the following curve-fit equation y bi (ebr + 2 1.0000 1.5431 3.7622 10.0677 27.3082 Define a function of the sum of squar...
 please solve using matlab
4. Nonlinear Regression Fit the below data with the following curve-fit equation y bi (ebr + 2 1.0000 1.5431 3.7622 10.0677 27.3082 Define a function of the sum of squared residuals (fSSR) as a function of the regression coefficients, b's. Minimize the fSSR function and determine the regression coefficients. Guess what would be the built-in math function to generate the original data? Plot the function in the existing figure with a smooth dashed line, calculate the...
please solve using matlab
4. Nonlinear Regression Fit the below data with the following curve-fit equation y bi (ebr + 2 1.0000 1.5431 3.7622 10.0677 27.3082 Define a function of the sum of squared residuals (fSSR) as a function of the regression coefficients, b's. Minimize the fSSR function and determine the regression coefficients. Guess what would be the built-in math function to generate the original data? Plot the function in the existing figure with a smooth dashed line, calculate the...
3. Suppose the following data has been obtained for the linear model Y -Bo+ yi 4 02-2 (a) Find th...
 3. Suppose the following data has been obtained for the linear model Y -Bo+ yi 4 02-2 (a) Find the OLS estimators po and pi using the non-matrix method. (b) Find the OLS estimators using the matrix method. e coefficient of determination. (d) Find the standard error of
3. Suppose the following data has been obtained for the linear model Y -Bo+ yi 4 02-2 (a) Find the OLS estimators po and pi using the non-matrix method. (b) Find the...
3. Suppose the following data has been obtained for the linear model Y -Bo+ yi 4 02-2 (a) Find the OLS estimators po and pi using the non-matrix method. (b) Find the OLS estimators using the matrix method. e coefficient of determination. (d) Find the standard error of
3. Suppose the following data has been obtained for the linear model Y -Bo+ yi 4 02-2 (a) Find the OLS estimators po and pi using the non-matrix method. (b) Find the...
The table shows the number of goals allowed and the total points earned (2 points for...
 The table shows the number of goals allowed and the total points earned (2 points for a win, and 1 point for an overtime or shootout loss) by 14 ice hockey teams over the course of a season. The equation of the regression line is y = -0.582x + 222.271. Use the data to answer the following questions (a) Find the coefficient of determination, and interpret the result (b) Find the standard error of the estimate, se, and interpret the...
please solve this it is numerical methods subject on paper not program Use multippe regression method...
 please solve this it is numerical methods subject on paper not
program
Use multippe regression method to fit the following data to the given model yA11+B.X2+C Find values A. Band and calculate coefficient of determination S, and standard error of estimates and standard deviation Use multipp:e regression method to fit the following data to the given model x1 x21 2 Y 0 26.95 12 13. 9162126 y = A.X1 + B.X2 +C Find values A, B and C and calculate...
please solve this it is numerical methods subject on paper not
program
Use multippe regression method to fit the following data to the given model yA11+B.X2+C Find values A. Band and calculate coefficient of determination S, and standard error of estimates and standard deviation Use multipp:e regression method to fit the following data to the given model x1 x21 2 Y 0 26.95 12 13. 9162126 y = A.X1 + B.X2 +C Find values A, B and C and calculate...
Consider the following data for two variables, x and y. (a) Develop an estimated regression equation...
 Consider the following data for two variables, x and y. (a) Develop an estimated regression equation for the data of the form ý = bo + 5,x. (Round bo to two decimal places and b, to three decimal places.) Comment on the adequacy of this equation for predicting y. (Use a = 0.05.) The high p-value and low coefficient of determination indicate that the equation is inadequate. The high p-value and high coefficient of determination indicate that the equation is...
How do I solve this problem? Problem 3 For the following differential equation, construct a finite...
 How do I solve this problem?
Problem 3 For the following differential equation, construct a finite difference approximation around point Xi that is accurate to second order, i.e., O(ha) where h is the step size. Write your answer in terms of Yi+2 = y(xi+2), Yi+1 = y(xi+1), yi = y(xi), and h. 2y + y - y=1
How do I solve this problem?
Problem 3 For the following differential equation, construct a finite difference approximation around point Xi that is accurate to second order, i.e., O(ha) where h is the step size. Write your answer in terms of Yi+2 = y(xi+2), Yi+1 = y(xi+1), yi = y(xi), and h. 2y + y - y=1
Given are five observations for two variables, x and y. xi Yi 1 4 2 7...
 Given are five observations for two variables, x and y. xi Yi 1 4 2 7 3 8 4 5 11 15 The estimated regression equation for these data is y = 1.2 + 2.6x. a. Compute SSE, SST, and SSR using the following equations (to 1 decimal). SSD = 2(y - ý) SST = 2(y; - 5)2 SSR = 2() - 12 SSE SST SSR b. Compute the coefficient of determination 2 (to 3 decimals). Does this least squares...
4. (35 points) Use multiple linear regression to fit the following experimental data, 12 1 4...
 4. (35 points) Use multiple linear regression to fit the following experimental data, 12 1 4 5.5 1.5 5 y 13 22 16 9 9 (a) Compute the coefficients, the coefficient of determination , the standard deviation Sy, and the standard error of the estimate S/. Show your calculations. (b) Write a MATLAB script that solves part (a).
 5. Consider the following data (You are allowed to use built-in function in R, but the code must be attached) X 99.0 101.1 102.7 103.0 105.4 107.0 108.7 110.8 112.1 112.4 113.6 113.8 115.1 115.4 120.0 y 28.8 27.9 27.0 25.2 22.8 21.5 20.9 19.6 17.1 18.9 16.0 16.7 13.0 13.6 10.8 (a) Obtain sample statistics such as sample mean of y and x and swa = n. 2-1(;- T)?, Say = n-1 =1(xi – 7)(yi – ). (b) Obtain...
 please solve using matlab
4. Nonlinear Regression Fit the below data with the following curve-fit equation y bi (ebr + 2 1.0000 1.5431 3.7622 10.0677 27.3082 Define a function of the sum of squared residuals (fSSR) as a function of the regression coefficients, b's. Minimize the fSSR function and determine the regression coefficients. Guess what would be the built-in math function to generate the original data? Plot the function in the existing figure with a smooth dashed line, calculate the...
please solve using matlab
4. Nonlinear Regression Fit the below data with the following curve-fit equation y bi (ebr + 2 1.0000 1.5431 3.7622 10.0677 27.3082 Define a function of the sum of squared residuals (fSSR) as a function of the regression coefficients, b's. Minimize the fSSR function and determine the regression coefficients. Guess what would be the built-in math function to generate the original data? Plot the function in the existing figure with a smooth dashed line, calculate the...
 3. Suppose the following data has been obtained for the linear model Y -Bo+ yi 4 02-2 (a) Find the OLS estimators po and pi using the non-matrix method. (b) Find the OLS estimators using the matrix method. e coefficient of determination. (d) Find the standard error of
3. Suppose the following data has been obtained for the linear model Y -Bo+ yi 4 02-2 (a) Find the OLS estimators po and pi using the non-matrix method. (b) Find the...
3. Suppose the following data has been obtained for the linear model Y -Bo+ yi 4 02-2 (a) Find the OLS estimators po and pi using the non-matrix method. (b) Find the OLS estimators using the matrix method. e coefficient of determination. (d) Find the standard error of
3. Suppose the following data has been obtained for the linear model Y -Bo+ yi 4 02-2 (a) Find the OLS estimators po and pi using the non-matrix method. (b) Find the...
 The table shows the number of goals allowed and the total points earned (2 points for a win, and 1 point for an overtime or shootout loss) by 14 ice hockey teams over the course of a season. The equation of the regression line is y = -0.582x + 222.271. Use the data to answer the following questions (a) Find the coefficient of determination, and interpret the result (b) Find the standard error of the estimate, se, and interpret the...
 please solve this it is numerical methods subject on paper not
program
Use multippe regression method to fit the following data to the given model yA11+B.X2+C Find values A. Band and calculate coefficient of determination S, and standard error of estimates and standard deviation Use multipp:e regression method to fit the following data to the given model x1 x21 2 Y 0 26.95 12 13. 9162126 y = A.X1 + B.X2 +C Find values A, B and C and calculate...
please solve this it is numerical methods subject on paper not
program
Use multippe regression method to fit the following data to the given model yA11+B.X2+C Find values A. Band and calculate coefficient of determination S, and standard error of estimates and standard deviation Use multipp:e regression method to fit the following data to the given model x1 x21 2 Y 0 26.95 12 13. 9162126 y = A.X1 + B.X2 +C Find values A, B and C and calculate...
 Consider the following data for two variables, x and y. (a) Develop an estimated regression equation for the data of the form ý = bo + 5,x. (Round bo to two decimal places and b, to three decimal places.) Comment on the adequacy of this equation for predicting y. (Use a = 0.05.) The high p-value and low coefficient of determination indicate that the equation is inadequate. The high p-value and high coefficient of determination indicate that the equation is...
 How do I solve this problem?
Problem 3 For the following differential equation, construct a finite difference approximation around point Xi that is accurate to second order, i.e., O(ha) where h is the step size. Write your answer in terms of Yi+2 = y(xi+2), Yi+1 = y(xi+1), yi = y(xi), and h. 2y + y - y=1
How do I solve this problem?
Problem 3 For the following differential equation, construct a finite difference approximation around point Xi that is accurate to second order, i.e., O(ha) where h is the step size. Write your answer in terms of Yi+2 = y(xi+2), Yi+1 = y(xi+1), yi = y(xi), and h. 2y + y - y=1
 Given are five observations for two variables, x and y. xi Yi 1 4 2 7 3 8 4 5 11 15 The estimated regression equation for these data is y = 1.2 + 2.6x. a. Compute SSE, SST, and SSR using the following equations (to 1 decimal). SSD = 2(y - ý) SST = 2(y; - 5)2 SSR = 2() - 12 SSE SST SSR b. Compute the coefficient of determination 2 (to 3 decimals). Does this least squares...
 4. (35 points) Use multiple linear regression to fit the following experimental data, 12 1 4 5.5 1.5 5 y 13 22 16 9 9 (a) Compute the coefficients, the coefficient of determination , the standard deviation Sy, and the standard error of the estimate S/. Show your calculations. (b) Write a MATLAB script that solves part (a).
Most questions answered within 3 hours.
-
Where is the error in this code sequence?
String s1 = "Hello";
String s2 = "ello";...
asked 10 months ago -
Financial data for Joel de Paris, Inc., for last year
follow:
Joel de Paris, Inc.
Balance...
asked 10 months ago -
Consider this reaction:
Al2(SO4)3 (aq)+ BaCl3
(aq) Al2Cl6 (aq)- +
3BaSO4(s) . What is the...
asked 10 months ago -
Suppose that Savneet is considering increasing her
recent random sample from 20 car rentals to 40...
asked 10 months ago -
Trucks arrive at an unloading terminal at an average rate of 120
per hour.
Trucks arrive...
asked 10 months ago -
Why are methanol and ethanol completely soluble in water while
octanol is not very little soluble....
asked 10 months ago -
A facilities manager at a university reads in a research report
that the mean amount of...
asked 10 months ago -
When the CuSO4 is rehydrated by adding water to the anhydrous
compound, is this an endothermic...
asked 10 months ago -
A ray of sunlight is passing from diamond into crown glass; the
angle of incidence is...
asked 10 months ago -
A block of mass 0.249 kg is placed on top of a light, vertical
spring of...
asked 10 months ago -
how do the kidneys compensate in the presences of acidosis
a) trigger hyperventilate
b) reserve acid...
asked 10 months ago -
Question 501 pts
The rental rate of capital to the firm increases. Which of the
following...
asked 10 months ago