* Please include Excel formulas so I can check my work *
| STANDING |
| 58 |
| 47 |
| 66 |
| 60 |
| 60 |
| 55 |
| 54 |
| 62 |
| 59 |
| 65 |
| 56 |
| 60 |
| 57 |
| 68 |
| 63 |
| 60 |
| 62 |
| 62 |
| 56 |
| 59 |
| 65 |
| 59 |
| 56 |
| 57 |
| 62 |
| 63 |
| 65 |
| 57 |
| 62 |
| 58 |
| 58 |
| 57 |
| 61 |
| 59 |
| 66 |
| 61 |
| 66 |
| 68 |
| 62 |
| 65 |
| 57 |
| 58 |
| 57 |
| 62 |
| 54 |
| 64 |
| 56 |
| 51 |
| 66 |
| 63 |
| 60 |
| 62 |
| 60 |
| 58 |
| 61 |
| 62 |
| 59 |
| 61 |
| 63 |
| 62 |
Homework Answers
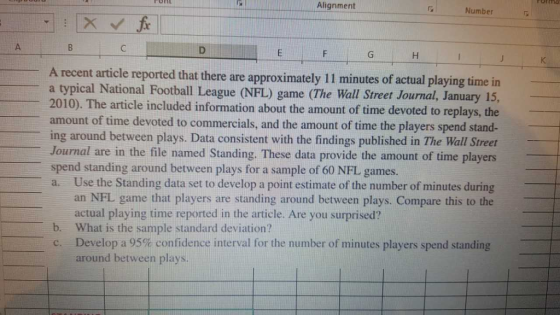
(a) Point estimate = sample mean =  = 60.2 minutes.
Yes, I am very much surprised, because the difference is quite big
(60 minutes compared to 11 minutes).
Excel formula -> =AVERAGE(A2:A61)
(b) Sample s.d. = 4.0245 minutes.
Excel formula -> =STDEV.S(A2:A61)

Add Answer to:
* Please include Excel formulas so I can check my work *
STANDING
58
47
66...
estimate the average age at which multiple sclerosis patients were diagnosed with the condition for the...
estimate the average age at which multiple sclerosis patients were diagnosed with the condition for the first time in a given city. How big should the sample be? Define your procedures for this estimate (if necessary, set your own values of unknown parameters, based on statistical theory). In Table 1 you will find all ages of this patient population. 54 58 56 48 62 59 55 56 60 52 53 61 56 56 53 37 71 62 39 61 54...
The Thompson Tire Company did research in Alabama regarding the miles their commercial truck tires would...
The Thompson Tire Company did research in Alabama regarding the miles their commercial truck tires would travel before they no longer met the Federal Highway Department tread depth requirements. The results of their study are in the file “Thompson Data Spring 2019” and show the mileage in 1,000 miles. Calculate the mean, median and mode of the data. Develop a box plot. Are there any outliers? Do the amounts follow a symmetric distribution or are they skewed? Justify your answer....
Consider the below matrixA, which you can copy and paste directly into Matlab.
Problem #1: Consider the below matrix A, which you can copy and paste directly into Matlab. The matrix contains 3 columns. The first column consists of Test #1 marks, the second column is Test # 2 marks, and the third column is final exam marks for a large linear algebra course. Each row represents a particular student.A = [36 45 75 81 59 73 77 73 73 65 72 78 65 55 83 73 57 78 84 31 60 83...
For determining half-lives of radioactive isotopes, it is important to know what the background radiation is...
 For determining half-lives of radioactive isotopes, it is important to know what the background radiation is in a given detector over a specific period. The following data were taken in a y -ray detection experiment over 98 ten-second intervals: 58 50 57 58 64 63 54 64 59 41 43 56 60 50 46 59 54 60 59 60 67 52 65 63 55 61 68 58 63 36 42 54 58 54 40 60 64 56 61 51 48...
Questions: A) We asked 60 Students about their High School Average. B) 63 72 60 59...
 Questions: A) We asked 60 Students about their High School Average. B) 63 72 60 59 68 50 65 58 63 76 60 59 68 65 6960 72 55 53 58 67 54 52 63 65 53 68 53 58 67 69 54 55 66 68 55 61 57 71 58 55 61 80 58 62 65 55 78 60 59 82 78 55 53 57 56 58 60 69 57 C) Find: Frequency distribution Table . D) E) The...
Problem 4: Variables that may affect Grades The data set contains a random sample of STAT 250 Final Exam Scores out of 80 points. For each individual sampled, the time (in hours per week) that the stu...
Problem 4: Variables that may affect Grades The data set contains a random sample of STAT 250 Final Exam Scores out of 80 points. For each individual sampled, the time (in hours per week) that the student spent participating in a GMU club or sport and working for pay outside of GMU was recorded. Values of 0 indicate the students either does not participate in a club or sport or does not work a job for pay. The goal of...
West Battery Corp. has recently been receiving complaints from retailers that its 9-volt batteries are not...
 West Battery Corp. has recently been receiving complaints from retailers that its 9-volt batteries are not lasting as long as other name brands. James West, head of the TOM program at West's Austin plant, believes there is no problem because his batteries have had an average life of 60 hours, about 10% longer than competitors' models. To raise the time above this level would require a new level of technology not available to West. Nevertheless, he is concerned enough to...
Problem 1: Confidence Interval for Percentage of B’s. The data set “STAT 250 Final Exam Scores”...
Problem 1: Confidence Interval for Percentage of B’s. The data set “STAT 250 Final Exam Scores” contains a random sample of 269 STAT 250 students’ final exam scores (maximum of 80) collected over the past two years. Answer the following questions using this data set. a) What proportion of students in our sample earned B’s on the final exam? A letter grade of B is obtained with a score of between 64 and 71 inclusive. Hint: You can do this...
Use the accompanying data set on the pulse rates (in beats per minute) of males to...
Use the accompanying data set on the pulse rates (in beats per minute) of males to complete parts (a) and (b) below. LOADING... Click the icon to view the pulse rates of males. a. Find the mean and standard deviation, and verify that the pulse rates have a distribution that is roughly normal. The mean of the pulse rates is 71.871.8 beats per minute. (Round to one decimal place as needed.) The standard deviation of the pulse rates is 12.212.2...
1. Forecast demand for Year 4. a. Explain what technique you utilized to forecast your demand....
 1. Forecast demand for Year 4.
a. Explain what technique you utilized to forecast your
demand.
b. Explain why you chose this technique over others.
Year 3 Year 1 Year 2 Actual Actual Actual Forecast Forecast Forecast Demand Demand Demand Week 1 52 57 63 55 66 77 Week 2 49 58 68 69 75 65 Week 3 47 50 58 65 80 74 Week 4 60 53 58 55 78 67 57 Week 5 49 57 64 76 77...
1. Forecast demand for Year 4.
a. Explain what technique you utilized to forecast your
demand.
b. Explain why you chose this technique over others.
Year 3 Year 1 Year 2 Actual Actual Actual Forecast Forecast Forecast Demand Demand Demand Week 1 52 57 63 55 66 77 Week 2 49 58 68 69 75 65 Week 3 47 50 58 65 80 74 Week 4 60 53 58 55 78 67 57 Week 5 49 57 64 76 77...
 For determining half-lives of radioactive isotopes, it is important to know what the background radiation is in a given detector over a specific period. The following data were taken in a y -ray detection experiment over 98 ten-second intervals: 58 50 57 58 64 63 54 64 59 41 43 56 60 50 46 59 54 60 59 60 67 52 65 63 55 61 68 58 63 36 42 54 58 54 40 60 64 56 61 51 48...
 Questions: A) We asked 60 Students about their High School Average. B) 63 72 60 59 68 50 65 58 63 76 60 59 68 65 6960 72 55 53 58 67 54 52 63 65 53 68 53 58 67 69 54 55 66 68 55 61 57 71 58 55 61 80 58 62 65 55 78 60 59 82 78 55 53 57 56 58 60 69 57 C) Find: Frequency distribution Table . D) E) The...
 West Battery Corp. has recently been receiving complaints from retailers that its 9-volt batteries are not lasting as long as other name brands. James West, head of the TOM program at West's Austin plant, believes there is no problem because his batteries have had an average life of 60 hours, about 10% longer than competitors' models. To raise the time above this level would require a new level of technology not available to West. Nevertheless, he is concerned enough to...
 1. Forecast demand for Year 4.
a. Explain what technique you utilized to forecast your
demand.
b. Explain why you chose this technique over others.
Year 3 Year 1 Year 2 Actual Actual Actual Forecast Forecast Forecast Demand Demand Demand Week 1 52 57 63 55 66 77 Week 2 49 58 68 69 75 65 Week 3 47 50 58 65 80 74 Week 4 60 53 58 55 78 67 57 Week 5 49 57 64 76 77...
1. Forecast demand for Year 4.
a. Explain what technique you utilized to forecast your
demand.
b. Explain why you chose this technique over others.
Year 3 Year 1 Year 2 Actual Actual Actual Forecast Forecast Forecast Demand Demand Demand Week 1 52 57 63 55 66 77 Week 2 49 58 68 69 75 65 Week 3 47 50 58 65 80 74 Week 4 60 53 58 55 78 67 57 Week 5 49 57 64 76 77...
Most questions answered within 3 hours.
-
Where is the error in this code sequence?
String s1 = "Hello";
String s2 = "ello";...
asked 10 months ago -
Financial data for Joel de Paris, Inc., for last year
follow:
Joel de Paris, Inc.
Balance...
asked 10 months ago -
Consider this reaction:
Al2(SO4)3 (aq)+ BaCl3
(aq) Al2Cl6 (aq)- +
3BaSO4(s) . What is the...
asked 10 months ago -
Suppose that Savneet is considering increasing her
recent random sample from 20 car rentals to 40...
asked 10 months ago -
Trucks arrive at an unloading terminal at an average rate of 120
per hour.
Trucks arrive...
asked 10 months ago -
Why are methanol and ethanol completely soluble in water while
octanol is not very little soluble....
asked 10 months ago -
A facilities manager at a university reads in a research report
that the mean amount of...
asked 10 months ago -
When the CuSO4 is rehydrated by adding water to the anhydrous
compound, is this an endothermic...
asked 10 months ago -
A ray of sunlight is passing from diamond into crown glass; the
angle of incidence is...
asked 10 months ago -
A block of mass 0.249 kg is placed on top of a light, vertical
spring of...
asked 10 months ago -
how do the kidneys compensate in the presences of acidosis
a) trigger hyperventilate
b) reserve acid...
asked 10 months ago -
Question 501 pts
The rental rate of capital to the firm increases. Which of the
following...
asked 10 months ago