b. Calculate the slope and y-intercept for the regression equation, SST, and Partition the SST into the SSR and the SSE.
(Round to three decimal places as needed.)
c. Provide an interpretation for the value of the slope.

Homework Answers
The statistical software output for this problem is :
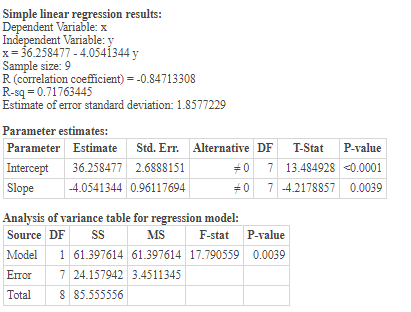
Intercept  0 = 36.258
Slope
1 = -4.054
SST = 85.556
SSR = 61.398
SSE = 24.158
Add Answer to:
b. Calculate the slope and y-intercept for the
regression equation, SST, and Partition the SST into...
2. Determine slope and y-intercept for the regression equation ? 3. Provide an interpretation for the...
 2. Determine slope and
y-intercept for the regression equation ?
3. Provide an interpretation for the value of the slope?
4. Predict the MPG for a sedan with a 2.5-liter engine
5. Calculate the SST
6. Partition the SST into the SSR and the SSE
Suppose an environmental agency would like to investigate the relationship between the engine size of sedans and the miles per gallon (MPG) they get. The accompanying table shows the engine size in cubic liters and...
2. Determine slope and
y-intercept for the regression equation ?
3. Provide an interpretation for the value of the slope?
4. Predict the MPG for a sedan with a 2.5-liter engine
5. Calculate the SST
6. Partition the SST into the SSR and the SSE
Suppose an environmental agency would like to investigate the relationship between the engine size of sedans and the miles per gallon (MPG) they get. The accompanying table shows the engine size in cubic liters and...
Please double check answers. Thanks. Suppose an environmental agency would like to investigate the relationship between...
 Please double check answers. Thanks.
Suppose an environmental agency would like to investigate the relationship between the engine size of sedans and the miles per gallon (MPG) they get. The accompanying table shows the engine size in cubic liters and rated miles per gallon for a selection of sedans. Use this information to complete parts a through f PG for 9 car models Table of Engine Size and MPG с. ar Model A Model B Model C Model D Model...
Please double check answers. Thanks.
Suppose an environmental agency would like to investigate the relationship between the engine size of sedans and the miles per gallon (MPG) they get. The accompanying table shows the engine size in cubic liters and rated miles per gallon for a selection of sedans. Use this information to complete parts a through f PG for 9 car models Table of Engine Size and MPG с. ar Model A Model B Model C Model D Model...
b) Calculate the slope and y-intercept for the regression equation. Therefore, the slope is_____ and the...
 b) Calculate the slope and
y-intercept for the regression equation.
Therefore, the slope is_____ and the y-intercept is_____.
c) Provide an interpretation for the value of the slope.
d) Calculate the SST.
e) Partition the SST into the SSR and the SSE.
Engine Size MPG ar Model A Model B Model C Model D Model E Model F Model G Model H Model I 2.4 2.1 2.6 3.3 3.5 2.2 2.3 2.1 3.8 25 31 25 24 27 25 30...
b) Calculate the slope and
y-intercept for the regression equation.
Therefore, the slope is_____ and the y-intercept is_____.
c) Provide an interpretation for the value of the slope.
d) Calculate the SST.
e) Partition the SST into the SSR and the SSE.
Engine Size MPG ar Model A Model B Model C Model D Model E Model F Model G Model H Model I 2.4 2.1 2.6 3.3 3.5 2.2 2.3 2.1 3.8 25 31 25 24 27 25 30...
4 Consider the following set of ordered pairs. a) Calculate the slope and y-intercept for these...
 4 Consider the following set of ordered pairs. a) Calculate the slope and y-intercept for these data. b) Calculate the total sum of squares (SST). c) Partition the sum of squares into the SSR and SSE. a) Calculate the slope and y-intercept for these data. y- Round to four decimal places as needed.) b) Calculate the total sum of squares (SST) SST c) Partition the sum of squares into the SSR and SSE. (Round to one decimal place as needed.)...
a) Calculate the slope and y-intercept for these data. b) Calculate the total sum of squares...
 a) Calculate the slope and y-intercept for these data. b) Calculate the total sum of squares (SST). c) Partition the sum of squares into the SSR and SSE. a) Calculate the slope and y-intercept for these data. y = + x (Round to four decimal places as needed.)
A) Calculate the slope and y-intercept for these data. B) Calculate the total sum of squares...
 A) Calculate the slope and y-intercept for these data.
B) Calculate the total sum of squares (SST).
C) Partition the sum of squares into the SSR and SSE.
Cursider she fallrwing set af ardered pairs a) Calculate the slope and y intercept for these dala. b) Caiculatc the total sum of squares ISST c) Pa ton the sum of squaresmo the SSH, and SSE sum ct saunto tme SSH
A) Calculate the slope and y-intercept for these data.
B) Calculate the total sum of squares (SST).
C) Partition the sum of squares into the SSR and SSE.
Cursider she fallrwing set af ardered pairs a) Calculate the slope and y intercept for these dala. b) Caiculatc the total sum of squares ISST c) Pa ton the sum of squaresmo the SSH, and SSE sum ct saunto tme SSH
For INTERCEPT() and SLOPE() functions, do we place x values or y values first in the...
For INTERCEPT() and SLOPE() functions, do we place x values or y values first in the parentheses? For CORREL() function, do we place x values or y values first in the parentheses? What is the difference in meaning between y and y_hat? What does the regression model minimize? SSE or SSR or SST? Variation in Y = Time explained by X = Miles is SST, SSR or SSE? Variation in Y = Time not explained by X = Miles is SST,...
answer c-e 2. Consider the following ordered pairs a. First draw a scatter plot with this...
 answer c-e
2. Consider the following ordered pairs a. First draw a scatter plot with this information LHHHH b. Then write the equation of a line. O i 234567 Y=9.5-0.58 c. Calculate the slope and y intercept for the linear regression equation d. Calculate the SST e. Partition the SST into SSR and SSE f. Calculate the coefficient of determination
answer c-e
2. Consider the following ordered pairs a. First draw a scatter plot with this information LHHHH b. Then write the equation of a line. O i 234567 Y=9.5-0.58 c. Calculate the slope and y intercept for the linear regression equation d. Calculate the SST e. Partition the SST into SSR and SSE f. Calculate the coefficient of determination
Consider the following set of ordered pairs. 5 4 1 n 5 5 3 2 4...
 Consider the following set of ordered pairs. 5 4 1 n 5 5 3 2 4 3 у 3 a) Calculate the slope and y-intercept for these data. b) Calculate the total sum of squares (SST). c) Partition the sum of squares into the SSR and SSE. a) Calculate the slope and y-intercept for these data. X у (Round to four decimal places as needed.) b) Calculate the total sum of squares (SST). SST = (Round to one decimal place...
Suppose a magazine would like to investigate the relationship between the battery? life, in? hours, and...
Suppose a magazine would like to investigate the relationship between the battery? life, in? hours, and the screen? size, in diagonal? inches, of a laptop computer. The accompanying table shows a random sample of eight laptops and the battery life and corresponding screen size of each. Use this information to complete parts a through e below. Battery Life (x)= 3.4, 3.9, 3.9, 3.9, 3.1, 3.8, 4.7, 3.9 Screen size (y)= 15.1, 17.4, 14.1, 12.1, 14.1, 13.4, 11.3, 12.7 a)correct scatter...
 2. Determine slope and
y-intercept for the regression equation ?
3. Provide an interpretation for the value of the slope?
4. Predict the MPG for a sedan with a 2.5-liter engine
5. Calculate the SST
6. Partition the SST into the SSR and the SSE
Suppose an environmental agency would like to investigate the relationship between the engine size of sedans and the miles per gallon (MPG) they get. The accompanying table shows the engine size in cubic liters and...
2. Determine slope and
y-intercept for the regression equation ?
3. Provide an interpretation for the value of the slope?
4. Predict the MPG for a sedan with a 2.5-liter engine
5. Calculate the SST
6. Partition the SST into the SSR and the SSE
Suppose an environmental agency would like to investigate the relationship between the engine size of sedans and the miles per gallon (MPG) they get. The accompanying table shows the engine size in cubic liters and...
 Please double check answers. Thanks.
Suppose an environmental agency would like to investigate the relationship between the engine size of sedans and the miles per gallon (MPG) they get. The accompanying table shows the engine size in cubic liters and rated miles per gallon for a selection of sedans. Use this information to complete parts a through f PG for 9 car models Table of Engine Size and MPG с. ar Model A Model B Model C Model D Model...
Please double check answers. Thanks.
Suppose an environmental agency would like to investigate the relationship between the engine size of sedans and the miles per gallon (MPG) they get. The accompanying table shows the engine size in cubic liters and rated miles per gallon for a selection of sedans. Use this information to complete parts a through f PG for 9 car models Table of Engine Size and MPG с. ar Model A Model B Model C Model D Model...
 b) Calculate the slope and
y-intercept for the regression equation.
Therefore, the slope is_____ and the y-intercept is_____.
c) Provide an interpretation for the value of the slope.
d) Calculate the SST.
e) Partition the SST into the SSR and the SSE.
Engine Size MPG ar Model A Model B Model C Model D Model E Model F Model G Model H Model I 2.4 2.1 2.6 3.3 3.5 2.2 2.3 2.1 3.8 25 31 25 24 27 25 30...
b) Calculate the slope and
y-intercept for the regression equation.
Therefore, the slope is_____ and the y-intercept is_____.
c) Provide an interpretation for the value of the slope.
d) Calculate the SST.
e) Partition the SST into the SSR and the SSE.
Engine Size MPG ar Model A Model B Model C Model D Model E Model F Model G Model H Model I 2.4 2.1 2.6 3.3 3.5 2.2 2.3 2.1 3.8 25 31 25 24 27 25 30...
 4 Consider the following set of ordered pairs. a) Calculate the slope and y-intercept for these data. b) Calculate the total sum of squares (SST). c) Partition the sum of squares into the SSR and SSE. a) Calculate the slope and y-intercept for these data. y- Round to four decimal places as needed.) b) Calculate the total sum of squares (SST) SST c) Partition the sum of squares into the SSR and SSE. (Round to one decimal place as needed.)...
 a) Calculate the slope and y-intercept for these data. b) Calculate the total sum of squares (SST). c) Partition the sum of squares into the SSR and SSE. a) Calculate the slope and y-intercept for these data. y = + x (Round to four decimal places as needed.)
 A) Calculate the slope and y-intercept for these data.
B) Calculate the total sum of squares (SST).
C) Partition the sum of squares into the SSR and SSE.
Cursider she fallrwing set af ardered pairs a) Calculate the slope and y intercept for these dala. b) Caiculatc the total sum of squares ISST c) Pa ton the sum of squaresmo the SSH, and SSE sum ct saunto tme SSH
A) Calculate the slope and y-intercept for these data.
B) Calculate the total sum of squares (SST).
C) Partition the sum of squares into the SSR and SSE.
Cursider she fallrwing set af ardered pairs a) Calculate the slope and y intercept for these dala. b) Caiculatc the total sum of squares ISST c) Pa ton the sum of squaresmo the SSH, and SSE sum ct saunto tme SSH
 answer c-e
2. Consider the following ordered pairs a. First draw a scatter plot with this information LHHHH b. Then write the equation of a line. O i 234567 Y=9.5-0.58 c. Calculate the slope and y intercept for the linear regression equation d. Calculate the SST e. Partition the SST into SSR and SSE f. Calculate the coefficient of determination
answer c-e
2. Consider the following ordered pairs a. First draw a scatter plot with this information LHHHH b. Then write the equation of a line. O i 234567 Y=9.5-0.58 c. Calculate the slope and y intercept for the linear regression equation d. Calculate the SST e. Partition the SST into SSR and SSE f. Calculate the coefficient of determination
 Consider the following set of ordered pairs. 5 4 1 n 5 5 3 2 4 3 у 3 a) Calculate the slope and y-intercept for these data. b) Calculate the total sum of squares (SST). c) Partition the sum of squares into the SSR and SSE. a) Calculate the slope and y-intercept for these data. X у (Round to four decimal places as needed.) b) Calculate the total sum of squares (SST). SST = (Round to one decimal place...
Most questions answered within 3 hours.
-
Where is the error in this code sequence?
String s1 = "Hello";
String s2 = "ello";...
asked 10 months ago -
Financial data for Joel de Paris, Inc., for last year
follow:
Joel de Paris, Inc.
Balance...
asked 10 months ago -
Consider this reaction:
Al2(SO4)3 (aq)+ BaCl3
(aq) Al2Cl6 (aq)- +
3BaSO4(s) . What is the...
asked 10 months ago -
Suppose that Savneet is considering increasing her
recent random sample from 20 car rentals to 40...
asked 10 months ago -
Trucks arrive at an unloading terminal at an average rate of 120
per hour.
Trucks arrive...
asked 10 months ago -
Why are methanol and ethanol completely soluble in water while
octanol is not very little soluble....
asked 10 months ago -
A facilities manager at a university reads in a research report
that the mean amount of...
asked 10 months ago -
When the CuSO4 is rehydrated by adding water to the anhydrous
compound, is this an endothermic...
asked 10 months ago -
A ray of sunlight is passing from diamond into crown glass; the
angle of incidence is...
asked 10 months ago -
A block of mass 0.249 kg is placed on top of a light, vertical
spring of...
asked 10 months ago -
how do the kidneys compensate in the presences of acidosis
a) trigger hyperventilate
b) reserve acid...
asked 10 months ago -
Question 501 pts
The rental rate of capital to the firm increases. Which of the
following...
asked 10 months ago