The following graphs outline the economy of the United States. The general price level is constant.
The following graphs outline the economy of the United States. The general price level is constant.
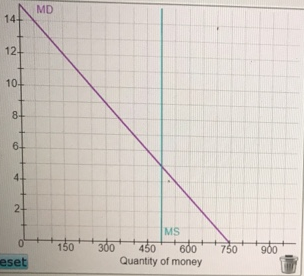
a) In the following graph plot the new MS line that corresponds to a decrease in the money supply that would increase the interest rate from 5% to 7%
b) Plot the new equilibrium point on the la line that shows the effect of the higher 7% interest rate on the level of investment spending
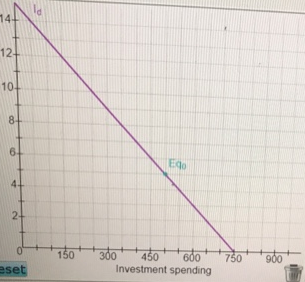
c) With the new interest rate what is the new level of investment spending?
Investment spending = $0
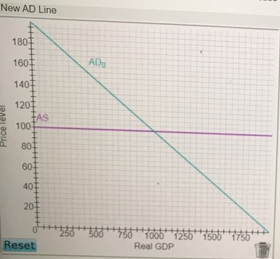
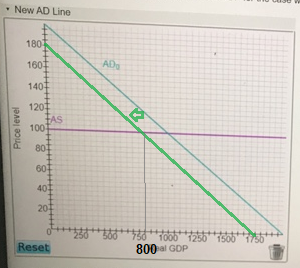
d) Plot the new AD line that shows the effect on real GDP for the case where for every $1.00 change in investment the aggregate demand changes by $4.00.
Homework Answers
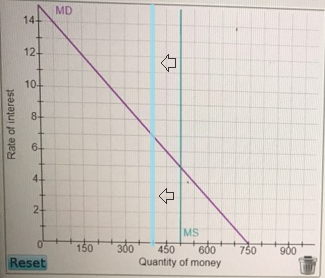
The MD has an inverse relatioship between quantity of money , and the equilibirum will move along the MD curve when MS shifts left.
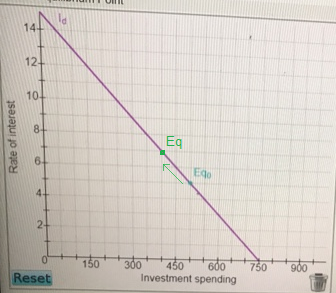

The investment decreased from 450 to 400, that is a decrease of $50
Thus a $50 decrease i ivestment will decrease AD by 50x4=$200
Add Answer to:
The following graphs outline the economy of the United States. The general price level is constant.
The following graph represents the money market in ahypothetical economy. As in the United States,...
 The following graph represents the money market in a
hypothetical economy. As in the United States, this economy has a
central bank called the Fed, but unlike in the United States, the
economy is closed (that is, the economy does not interact with
other economies in the world). The money market is currently in
equilibrium at an interest rate of 4% and a quantity of money equal
to $0.4 trillion, as indicated by the grey star.? Suppose the Fed announces that...
The following graph represents the money market in a
hypothetical economy. As in the United States, this economy has a
central bank called the Fed, but unlike in the United States, the
economy is closed (that is, the economy does not interact with
other economies in the world). The money market is currently in
equilibrium at an interest rate of 4% and a quantity of money equal
to $0.4 trillion, as indicated by the grey star.? Suppose the Fed announces that...
Question 16 If the price level increases in the United States relative to foreign...
Question 16 (1 point)If the price level increases in the United States relative to foreign countries, then American consumers will purchase more foreign goods and fewer U.S. goods. This statement describes:Question 16 options:the output effect.the shift-of-spending effect.the real-balances effect.the foreign purchases effect.Question 17 (1 point)Refer to the diagram. If the initial aggregate demand and supply curves are AD0 and AS0, the equilibrium price level and level of real domestic output will be:Question 17 options:E and B, respectively.F and A, respectively.G...
Using the graphs below, show the change in aggregate demand for each of the following scenarios. a. There Is a change I...
 Using the graphs below, show the change in aggregate demand for each of the following scenarios. a. There Is a change In government policy that causes an Increase In Interest rates Instructions: Use the tool provided AD to plot the new aggregate demand curve. Plot only the endpolnts of the line (2 polnts total). Aggregate Demand Tools AD AD Real GDP b. After the election, consumers begin to feel optimistic about the future of the economy, which causes an Increase...
Assume the U.S. economy is in both short-run and long-run equilibrium, as shown in the graph...
 Assume the U.S. economy is in both short-run and long-run equilibrium, as shown in the graph below. Suppose the federal government increases the amount of spending on the military. either the new a. Show the effect on the short-run equilibrium as a result of increased government spending. Using the graph, dra AD curve or new AS curve resulting from this change in spending. Instructions: Use the tool provided 'New Curve' to plot the appropriate line. After placing the curve, click...
The following table shows the real output demanded and supplied at various price levels in a...
The following table shows the real output demanded and supplied at various price levels in a hypothetical economy. Real Output Demanded Price Level Real Output Supplied (Billions of dollars) (Index number) (Billions of dollars) 40 160 340 80 120 320 120 80 280 200 40 200 320 20 80 On the following graph, use the blue points (circle symbol) to plot the aggregate demand (Initial AD) curve for the economy. Then use the orange points (square symbol) to plot the...
The following graphs show the state of an economy that is currently in long-run equilibrium.
 3. The long-run effects of monetary policy The following graphs show the state of an economy that is currently in long-run equilibrium. The first graph shows the aggregate demand (AD) and long-run aggregate supply (LRAS) curves. The second shows the long-run and short-run Phillips curves (LRPC and SRPC).Which of the following statements are true based on these graphs? Check all that apply The natural level of output is $3 trillion. The unemployment rate is currently 6% higher than the natural rate of unemployment. The...
Check And < Question 11 of 13 > The graphs below illustrate an initial equilibrium for...
 Check And < Question 11 of 13 > The graphs below illustrate an initial equilibrium for the economy. Suppose that investment spending falls. Use the graphs to show the new positions of aggregate demand (AD), short-run aggregate supply (SRAS), and long-run aggregate supply (LRAS) in both the short-run and the long-run, as well as the short-run and long-run equilibria resulting from this change. Then answer what happens to the price level and GDP. Short-run graph SRAS Short-run equilibrium Aggregate price...
The following graph represents the money market in a hypothetical economy.
 Changes in the money supply The following graph represents the money market in a hypothetical economy. As in the United States, this economy has a central bank called the Fede but unlike in the United States, the economy is closed that is, the economy does not interact with other economies in the world). The money market Currently in equilibrium at an interest rate of 4.5% and a quantity of money equal to $ 0.4 trillion, as indicated by the grey star.Suppose...
The graphs illustrate an initial equilibrium for the economy. Suppose that oil prices temporarily decrease Use...
 The graphs illustrate an initial equilibrium for the economy. Suppose that oil prices temporarily decrease Use the graphs to show the new positions of aggregate demand (AD), short-run aggregate supply (SRAS), and long-run aggregate supply (LRAS) in both the short run and the long run, as well as the short-run and long-run equilibriums resulting from this change. Then, indicate what happens to the price level and GDP in the short run and in the long run. Short-run graph Long-run graph...
In 2008, the United States is in a recession. The following measures are implemented: The Fed...
 In 2008, the United States is in a recession. The following measures are implemented: The Fed purchases securities. At the same time, the federal government cuts taxes. Illustrate with an AD/AS graph the effect of these measures on the economy. Indicate the change in real GDP, the price level and the unemployment rate.
 The following graph represents the money market in a
hypothetical economy. As in the United States, this economy has a
central bank called the Fed, but unlike in the United States, the
economy is closed (that is, the economy does not interact with
other economies in the world). The money market is currently in
equilibrium at an interest rate of 4% and a quantity of money equal
to $0.4 trillion, as indicated by the grey star.? Suppose the Fed announces that...
The following graph represents the money market in a
hypothetical economy. As in the United States, this economy has a
central bank called the Fed, but unlike in the United States, the
economy is closed (that is, the economy does not interact with
other economies in the world). The money market is currently in
equilibrium at an interest rate of 4% and a quantity of money equal
to $0.4 trillion, as indicated by the grey star.? Suppose the Fed announces that...
 Using the graphs below, show the change in aggregate demand for each of the following scenarios. a. There Is a change In government policy that causes an Increase In Interest rates Instructions: Use the tool provided AD to plot the new aggregate demand curve. Plot only the endpolnts of the line (2 polnts total). Aggregate Demand Tools AD AD Real GDP b. After the election, consumers begin to feel optimistic about the future of the economy, which causes an Increase...
 Assume the U.S. economy is in both short-run and long-run equilibrium, as shown in the graph below. Suppose the federal government increases the amount of spending on the military. either the new a. Show the effect on the short-run equilibrium as a result of increased government spending. Using the graph, dra AD curve or new AS curve resulting from this change in spending. Instructions: Use the tool provided 'New Curve' to plot the appropriate line. After placing the curve, click...
 Check And < Question 11 of 13 > The graphs below illustrate an initial equilibrium for the economy. Suppose that investment spending falls. Use the graphs to show the new positions of aggregate demand (AD), short-run aggregate supply (SRAS), and long-run aggregate supply (LRAS) in both the short-run and the long-run, as well as the short-run and long-run equilibria resulting from this change. Then answer what happens to the price level and GDP. Short-run graph SRAS Short-run equilibrium Aggregate price...
 The graphs illustrate an initial equilibrium for the economy. Suppose that oil prices temporarily decrease Use the graphs to show the new positions of aggregate demand (AD), short-run aggregate supply (SRAS), and long-run aggregate supply (LRAS) in both the short run and the long run, as well as the short-run and long-run equilibriums resulting from this change. Then, indicate what happens to the price level and GDP in the short run and in the long run. Short-run graph Long-run graph...
 In 2008, the United States is in a recession. The following measures are implemented: The Fed purchases securities. At the same time, the federal government cuts taxes. Illustrate with an AD/AS graph the effect of these measures on the economy. Indicate the change in real GDP, the price level and the unemployment rate.
Most questions answered within 3 hours.
-
Where is the error in this code sequence?
String s1 = "Hello";
String s2 = "ello";...
asked 11 months ago -
Financial data for Joel de Paris, Inc., for last year
follow:
Joel de Paris, Inc.
Balance...
asked 11 months ago -
Consider this reaction:
Al2(SO4)3 (aq)+ BaCl3
(aq) Al2Cl6 (aq)- +
3BaSO4(s) . What is the...
asked 11 months ago -
Suppose that Savneet is considering increasing her
recent random sample from 20 car rentals to 40...
asked 11 months ago -
Trucks arrive at an unloading terminal at an average rate of 120
per hour.
Trucks arrive...
asked 11 months ago -
Why are methanol and ethanol completely soluble in water while
octanol is not very little soluble....
asked 11 months ago -
A facilities manager at a university reads in a research report
that the mean amount of...
asked 11 months ago -
When the CuSO4 is rehydrated by adding water to the anhydrous
compound, is this an endothermic...
asked 11 months ago -
A ray of sunlight is passing from diamond into crown glass; the
angle of incidence is...
asked 11 months ago -
A block of mass 0.249 kg is placed on top of a light, vertical
spring of...
asked 11 months ago -
how do the kidneys compensate in the presences of acidosis
a) trigger hyperventilate
b) reserve acid...
asked 11 months ago -
Question 501 pts
The rental rate of capital to the firm increases. Which of the
following...
asked 11 months ago