
Homework Answers
Add Answer to:
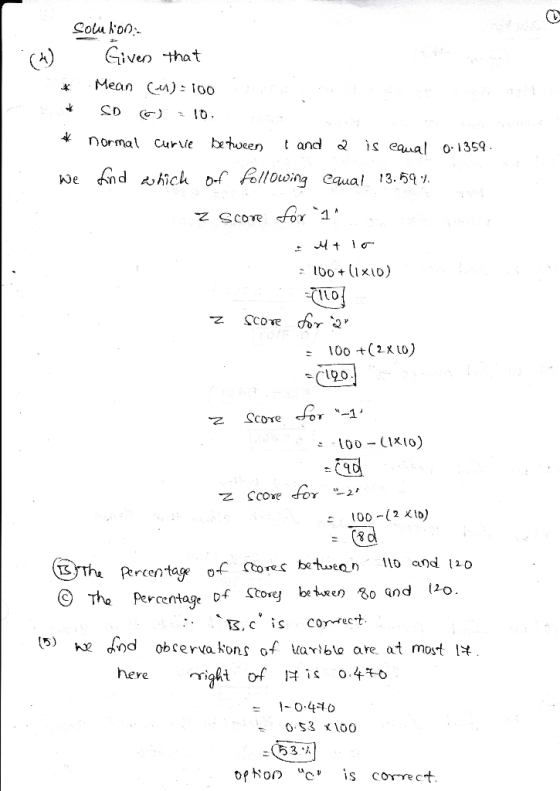
4) Provide an appropriate response. 4) The area under the standard normal curve between 1 and...
6) Provide an appropriate response. Round to the nearest hundredth 6) Find the standard deviation for...
 6) Provide an appropriate response. Round to the nearest hundredth 6) Find the standard deviation for the given probability distribution XP(x) 0 0.19 1 10.26 2 0.18 3 0.24 4 0.13 A) = 1.40 B) c = 1.76 C) = 1.33 D) 0 = 2.28 Find the mean, u, for the binomial distribution which has the stated values of nand p. Round answer to the nearest tenth. 7) n = 1599; p=0.57 A) u = 9057 B) 4 = 913.0...
(a)Find the area under the standard normal curve that lies between = z − 1.71 and...
(a)Find the area under the standard normal curve that lies between = z − 1.71 and = z 1.25 . (b)Find the area under the standard normal curve that lies between = z − 1.98 and = z − 1.28 . (c)Find the area under the standard normal curve that lies between = z 0.61 and = z 1.72 . (d)Find the area under the standard normal curve that lies between = z − 2.45 and = z 1.92 .
The area under the normal curve between Z = 1 and Z = 2 is ________________...
The area under the normal curve between Z = 1 and Z = 2 is ________________ the area under the normal curve between Z = 0 and Z = 1. A. Less than B. Greater than C. Equal to D. A, B or C above dependent on the value of the mean E. A, B or C above dependent on the value of the standard deviation
The area under the normal curve between Z= -1.0 and Z = -2.0 is A) 0.3413 B) 0.1359...
The area under the normal curve between Z= -1.0 and Z = -2.0 is A) 0.3413 B) 0.1359 C) 0.4772 D) 0.0228 2. Find Z if the area to the right of Z is 0.67 A) 0.9100 B) 0.0421 C) -0.4500 D) -0.390
Determine the area under the standard normal curve that lies between (a) Z=−1.72 and Z=1.72, (b)...
Determine the area under the standard normal curve that lies between (a) Z=−1.72 and Z=1.72, (b) Z=−2.89 and Z=0, and (c) Z=−0.43 and Z=0.96. Find the z-score such that the area under the standard normal curve to the left is 0.57. Find the z-score such that the area under the standard normal curve to the right is 0.11. The approximate z-score that corresponds to a right tail area of 0.11 is ___. Find the z-scores that separate the middle 31%...
Find the area under the standard normal curve between -2.1 and 2.1. answer: (b) Find the...
Find the area under the standard normal curve between -2.1 and 2.1. answer: (b) Find the area under the standard normal curve between -0.65 and 0.65. answer: (c) Find the area under the standard normal curve that lies to the left of 2.1. answer: (d) Find the area under the standard normal curve that lies to the right of 2.1. answer:
Find the area under the standard normal curve between −2.15 and 0.85. answer: (b) Find the...
Find the area under the standard normal curve between −2.15 and 0.85. answer: (b) Find the area under the standard normal curve between −2.06 and 1.11 answer: (c) Find the area under the standard normal curve that lies to the left of 2.01 answer: (d) Find the area under the standard normal curve that lies to the left of −1.9. answer: (e) Find the area under the standard normal curve that lies to the right of −1.64. answer: (f) Find...
6. Area under the normal distribution The following figure shows the normal distribution with the proportion...
 6. Area under the normal distribution The following figure shows the normal distribution with the proportion of the area under the normal curve contained within one, two, and three standard deviations of the mean. The last proportion on each side, 0.13%, depicts the remaining area under the curve. Specifically, 0.13% of the area under the standard normal distribution is located above z-score values greater than the mean (u) plus three standard deviations (+30). Also, because the normal distribution is symmetrical,...
Find the area under the standard normal curve that lies outside the interval between following two...
Find the area under the standard normal curve that lies outside the interval between following two values. Round the answers to at least four decimal places. (a)Find the area under the standard normal curve that lies outside the interval between z=−1.43 and z=1.34 (b)Find the area under the standard normal curve that lies outside the interval between z=−1.63 and z=0.94 (c)Find the area under the standard normal curve that lies outside the interval between z=1.17 and z=1.74 (d)Find the area...
help Using the TI-84 calculator, find the area under the standard normal curve that lies between...
 help
Using the TI-84 calculator, find the area under the standard normal curve that lies between the following --values. Round the answers to four decimal places. (a) Find the area under the standard normal curve that lies between := -2.04 and = = 0.91. (b) Find the area under the standard normal curve that lies between := -2.31 and == -2.13. (c) Find the area under the standard normal curve that lies between :=0.27 and = = 1.07 (d) Find...
help
Using the TI-84 calculator, find the area under the standard normal curve that lies between the following --values. Round the answers to four decimal places. (a) Find the area under the standard normal curve that lies between := -2.04 and = = 0.91. (b) Find the area under the standard normal curve that lies between := -2.31 and == -2.13. (c) Find the area under the standard normal curve that lies between :=0.27 and = = 1.07 (d) Find...
 6) Provide an appropriate response. Round to the nearest hundredth 6) Find the standard deviation for the given probability distribution XP(x) 0 0.19 1 10.26 2 0.18 3 0.24 4 0.13 A) = 1.40 B) c = 1.76 C) = 1.33 D) 0 = 2.28 Find the mean, u, for the binomial distribution which has the stated values of nand p. Round answer to the nearest tenth. 7) n = 1599; p=0.57 A) u = 9057 B) 4 = 913.0...
 6. Area under the normal distribution The following figure shows the normal distribution with the proportion of the area under the normal curve contained within one, two, and three standard deviations of the mean. The last proportion on each side, 0.13%, depicts the remaining area under the curve. Specifically, 0.13% of the area under the standard normal distribution is located above z-score values greater than the mean (u) plus three standard deviations (+30). Also, because the normal distribution is symmetrical,...
 help
Using the TI-84 calculator, find the area under the standard normal curve that lies between the following --values. Round the answers to four decimal places. (a) Find the area under the standard normal curve that lies between := -2.04 and = = 0.91. (b) Find the area under the standard normal curve that lies between := -2.31 and == -2.13. (c) Find the area under the standard normal curve that lies between :=0.27 and = = 1.07 (d) Find...
help
Using the TI-84 calculator, find the area under the standard normal curve that lies between the following --values. Round the answers to four decimal places. (a) Find the area under the standard normal curve that lies between := -2.04 and = = 0.91. (b) Find the area under the standard normal curve that lies between := -2.31 and == -2.13. (c) Find the area under the standard normal curve that lies between :=0.27 and = = 1.07 (d) Find...
Most questions answered within 3 hours.
-
Where is the error in this code sequence?
String s1 = "Hello";
String s2 = "ello";...
asked 10 months ago -
Financial data for Joel de Paris, Inc., for last year
follow:
Joel de Paris, Inc.
Balance...
asked 10 months ago -
Consider this reaction:
Al2(SO4)3 (aq)+ BaCl3
(aq) Al2Cl6 (aq)- +
3BaSO4(s) . What is the...
asked 10 months ago -
Suppose that Savneet is considering increasing her
recent random sample from 20 car rentals to 40...
asked 10 months ago -
Trucks arrive at an unloading terminal at an average rate of 120
per hour.
Trucks arrive...
asked 10 months ago -
Why are methanol and ethanol completely soluble in water while
octanol is not very little soluble....
asked 10 months ago -
A facilities manager at a university reads in a research report
that the mean amount of...
asked 10 months ago -
When the CuSO4 is rehydrated by adding water to the anhydrous
compound, is this an endothermic...
asked 10 months ago -
A ray of sunlight is passing from diamond into crown glass; the
angle of incidence is...
asked 10 months ago -
A block of mass 0.249 kg is placed on top of a light, vertical
spring of...
asked 10 months ago -
how do the kidneys compensate in the presences of acidosis
a) trigger hyperventilate
b) reserve acid...
asked 10 months ago -
Question 501 pts
The rental rate of capital to the firm increases. Which of the
following...
asked 10 months ago