

Homework Answers

 kindly please upvote this
Add Answer to:
Can i please get some step by step solutions for these
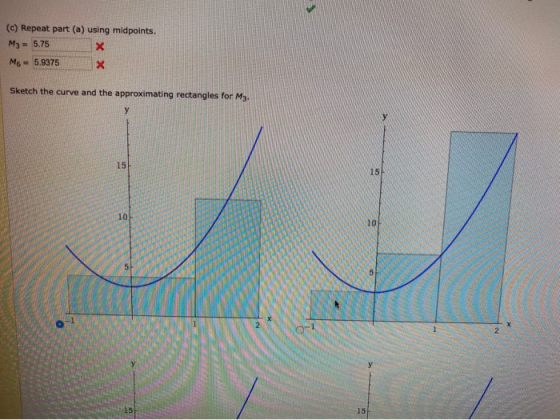
endpoints?
(a) Estimate the area...
(a) Estimate the area under the graph of f(x) = 4 + 4x2 from x =...
 (a) Estimate the area under the graph of f(x) = 4 + 4x2 from x = -1 to x = 2 using three rectangles and right endpoints. R3 = 32 Then improve your estimate by using six rectangles. RG :- 27.5 Sketch the curve and the approximating rectangles for R3. у 20 у 20 15 15 10 10 O-1 2 у у 20 20 15 15 10 10 5 -1 1 2 1 2 Sketch the curve and the approximating...
O y=x10 on [0, 2] ys(1 + x)22 on [1,3] Need Help? Hoad (a) Estimate the area under the graph of f...
 answer all parts please
o y=x10 on [0, 2] ys(1 + x)22 on [1,3] Need Help? Hoad (a) Estimate the area under the graph of fx) -2 + 2x2 from x--1 to x -2 using three rectangles and right endpoints Then improve your estimate by using six rectangles. Sketch the curve and the approximating rectangles for R3 아 10 4 O Type here to search ⓘ슐 https://www.webassign.net/ eb Student/Assignment Responses ast?dep-211; eb 2.0 scientific cal.c..Periodic TableWorks.p... PBDAT breakdown (don.. kupdf.net...
answer all parts please
o y=x10 on [0, 2] ys(1 + x)22 on [1,3] Need Help? Hoad (a) Estimate the area under the graph of fx) -2 + 2x2 from x--1 to x -2 using three rectangles and right endpoints Then improve your estimate by using six rectangles. Sketch the curve and the approximating rectangles for R3 아 10 4 O Type here to search ⓘ슐 https://www.webassign.net/ eb Student/Assignment Responses ast?dep-211; eb 2.0 scientific cal.c..Periodic TableWorks.p... PBDAT breakdown (don.. kupdf.net...
PLEASE SHOW WORK WITH CLEAR STEPS 11. f (x) 5- x2 Estimate the area under the graph from x1 to x 2 using three rectangles and right endpoints. Then improve your estimate by using six rectangles. Sketc...
 PLEASE SHOW WORK WITH CLEAR
STEPS
11. f (x) 5- x2 Estimate the area under the graph from x1 to x 2 using three rectangles and right endpoints. Then improve your estimate by using six rectangles. Sketch the curve and the approximating rectangles. ее
11. f (x) 5- x2 Estimate the area under the graph from x1 to x 2 using three rectangles and right endpoints. Then improve your estimate by using six rectangles. Sketch the curve and the approximating...
PLEASE SHOW WORK WITH CLEAR
STEPS
11. f (x) 5- x2 Estimate the area under the graph from x1 to x 2 using three rectangles and right endpoints. Then improve your estimate by using six rectangles. Sketch the curve and the approximating rectangles. ее
11. f (x) 5- x2 Estimate the area under the graph from x1 to x 2 using three rectangles and right endpoints. Then improve your estimate by using six rectangles. Sketch the curve and the approximating...
(10 points) Use six rectangles to find an estimate of each type for the area under the given graph off from x...
 (10 points) Use six rectangles to find an estimate of each type for the area under the given graph off from x = 0 to x = 12. 1. Take the sample points from the left- endpoints Answer: L6 - 2. Is your estimate L6 an underestimate or overestimate of the true area? Choose one 3. Take the sample points from the right- endpoints. Answer: R6 1. Take the sample points from the left- endpoints. Answer: L - 2. Is...
Estimate the area under the graph of f(x) rectangles and right endpoints. 1 over the interval...
 Estimate the area under the graph of f(x) rectangles and right endpoints. 1 over the interval [ - 2, 3] using ten approximating +3 RE Repeat the approximation using left endpoints. Ln = Report answers accurate to 4 places. Remember not to round too early in your calculations.
(a) Estimate the area under the graph of f(x) = 2/x from x = 1 to...
 (a) Estimate the area under the graph of f(x) = 2/x from x = 1 to x = 5 using four approximating rectangles and right endpoints. | R = (b) Repeat part (a) using left endpoints. L = (c) By looking at a sketch of the graph and the rectangles, determine for each estimate whether is overestimates, underestimates, or is the exact area. ? 1. R4 42. L
Estimate the area under the graph of f(x)=x^2−2x+4x over the interval [0,8] using eight approximating rectangles...
Estimate the area under the graph of f(x)=x^2−2x+4x over the interval [0,8] using eight approximating rectangles and right endpoints. Rn= Repeat the approximation using left endpoints. Ln=
Help please !!! answer all questions. thank u so much~! 1 Estimate the area under the...
 Help please !!! answer all questions. thank u so much~!
1 Estimate the area under the graph of f(x) rectangles and right endpoints. over the interval [0, 4] using five approximating x +4 Rn = Repeat the approximation using left endpoints. Ln= Report answers accurate to 4 places. Remember not to round too early in your calculations. Using Left Endpoint approximation, complete the following problems. Approximate the area under the curve f(x) = – 0.4x2 + 22 between x =...
Help please !!! answer all questions. thank u so much~!
1 Estimate the area under the graph of f(x) rectangles and right endpoints. over the interval [0, 4] using five approximating x +4 Rn = Repeat the approximation using left endpoints. Ln= Report answers accurate to 4 places. Remember not to round too early in your calculations. Using Left Endpoint approximation, complete the following problems. Approximate the area under the curve f(x) = – 0.4x2 + 22 between x =...
Consider the function x)-3x+2 Estimate the area between the graph of f and the x axis...
 Consider the function x)-3x+2 Estimate the area between the graph of f and the x axis between x-o and x-3 using six rectangles and right endpoints. Round your answer to two decimal places. Sketch the graph and the rectangles (b) Repeat part (a) using left endpoints. (Round your answer to two decimal places.) (b) Repeat part (a) using left endpoints. (Round your answer to two decimal places.) Sketch the graph and the rectangles -2 Need Help?
• Question 16 B0/10 pts over the interval [2, 7) using ten approximating Estimate the area...
 • Question 16 B0/10 pts over the interval [2, 7) using ten approximating Estimate the area under the graph of f(x) = rectangles and right endpoints. Rn = Repeat the approximation using left endpoints. Ln = Report answers accurate to places. Remember not to round too early in your calculations. Question Help: Video Submit Question . Question 13 B0/10 pts 498 OD When estimating distances from a table of velocity data, it is not necessary that the time intervals are...
 (a) Estimate the area under the graph of f(x) = 4 + 4x2 from x = -1 to x = 2 using three rectangles and right endpoints. R3 = 32 Then improve your estimate by using six rectangles. RG :- 27.5 Sketch the curve and the approximating rectangles for R3. у 20 у 20 15 15 10 10 O-1 2 у у 20 20 15 15 10 10 5 -1 1 2 1 2 Sketch the curve and the approximating...
 answer all parts please
o y=x10 on [0, 2] ys(1 + x)22 on [1,3] Need Help? Hoad (a) Estimate the area under the graph of fx) -2 + 2x2 from x--1 to x -2 using three rectangles and right endpoints Then improve your estimate by using six rectangles. Sketch the curve and the approximating rectangles for R3 아 10 4 O Type here to search ⓘ슐 https://www.webassign.net/ eb Student/Assignment Responses ast?dep-211; eb 2.0 scientific cal.c..Periodic TableWorks.p... PBDAT breakdown (don.. kupdf.net...
answer all parts please
o y=x10 on [0, 2] ys(1 + x)22 on [1,3] Need Help? Hoad (a) Estimate the area under the graph of fx) -2 + 2x2 from x--1 to x -2 using three rectangles and right endpoints Then improve your estimate by using six rectangles. Sketch the curve and the approximating rectangles for R3 아 10 4 O Type here to search ⓘ슐 https://www.webassign.net/ eb Student/Assignment Responses ast?dep-211; eb 2.0 scientific cal.c..Periodic TableWorks.p... PBDAT breakdown (don.. kupdf.net...
 PLEASE SHOW WORK WITH CLEAR
STEPS
11. f (x) 5- x2 Estimate the area under the graph from x1 to x 2 using three rectangles and right endpoints. Then improve your estimate by using six rectangles. Sketch the curve and the approximating rectangles. ее
11. f (x) 5- x2 Estimate the area under the graph from x1 to x 2 using three rectangles and right endpoints. Then improve your estimate by using six rectangles. Sketch the curve and the approximating...
PLEASE SHOW WORK WITH CLEAR
STEPS
11. f (x) 5- x2 Estimate the area under the graph from x1 to x 2 using three rectangles and right endpoints. Then improve your estimate by using six rectangles. Sketch the curve and the approximating rectangles. ее
11. f (x) 5- x2 Estimate the area under the graph from x1 to x 2 using three rectangles and right endpoints. Then improve your estimate by using six rectangles. Sketch the curve and the approximating...
 (10 points) Use six rectangles to find an estimate of each type for the area under the given graph off from x = 0 to x = 12. 1. Take the sample points from the left- endpoints Answer: L6 - 2. Is your estimate L6 an underestimate or overestimate of the true area? Choose one 3. Take the sample points from the right- endpoints. Answer: R6 1. Take the sample points from the left- endpoints. Answer: L - 2. Is...
 Estimate the area under the graph of f(x) rectangles and right endpoints. 1 over the interval [ - 2, 3] using ten approximating +3 RE Repeat the approximation using left endpoints. Ln = Report answers accurate to 4 places. Remember not to round too early in your calculations.
 (a) Estimate the area under the graph of f(x) = 2/x from x = 1 to x = 5 using four approximating rectangles and right endpoints. | R = (b) Repeat part (a) using left endpoints. L = (c) By looking at a sketch of the graph and the rectangles, determine for each estimate whether is overestimates, underestimates, or is the exact area. ? 1. R4 42. L
 Help please !!! answer all questions. thank u so much~!
1 Estimate the area under the graph of f(x) rectangles and right endpoints. over the interval [0, 4] using five approximating x +4 Rn = Repeat the approximation using left endpoints. Ln= Report answers accurate to 4 places. Remember not to round too early in your calculations. Using Left Endpoint approximation, complete the following problems. Approximate the area under the curve f(x) = – 0.4x2 + 22 between x =...
Help please !!! answer all questions. thank u so much~!
1 Estimate the area under the graph of f(x) rectangles and right endpoints. over the interval [0, 4] using five approximating x +4 Rn = Repeat the approximation using left endpoints. Ln= Report answers accurate to 4 places. Remember not to round too early in your calculations. Using Left Endpoint approximation, complete the following problems. Approximate the area under the curve f(x) = – 0.4x2 + 22 between x =...
 Consider the function x)-3x+2 Estimate the area between the graph of f and the x axis between x-o and x-3 using six rectangles and right endpoints. Round your answer to two decimal places. Sketch the graph and the rectangles (b) Repeat part (a) using left endpoints. (Round your answer to two decimal places.) (b) Repeat part (a) using left endpoints. (Round your answer to two decimal places.) Sketch the graph and the rectangles -2 Need Help?
 • Question 16 B0/10 pts over the interval [2, 7) using ten approximating Estimate the area under the graph of f(x) = rectangles and right endpoints. Rn = Repeat the approximation using left endpoints. Ln = Report answers accurate to places. Remember not to round too early in your calculations. Question Help: Video Submit Question . Question 13 B0/10 pts 498 OD When estimating distances from a table of velocity data, it is not necessary that the time intervals are...
Most questions answered within 3 hours.
-
Where is the error in this code sequence?
String s1 = "Hello";
String s2 = "ello";...
asked 10 months ago -
Financial data for Joel de Paris, Inc., for last year
follow:
Joel de Paris, Inc.
Balance...
asked 10 months ago -
Consider this reaction:
Al2(SO4)3 (aq)+ BaCl3
(aq) Al2Cl6 (aq)- +
3BaSO4(s) . What is the...
asked 10 months ago -
Suppose that Savneet is considering increasing her
recent random sample from 20 car rentals to 40...
asked 10 months ago -
Trucks arrive at an unloading terminal at an average rate of 120
per hour.
Trucks arrive...
asked 10 months ago -
Why are methanol and ethanol completely soluble in water while
octanol is not very little soluble....
asked 10 months ago -
A facilities manager at a university reads in a research report
that the mean amount of...
asked 10 months ago -
When the CuSO4 is rehydrated by adding water to the anhydrous
compound, is this an endothermic...
asked 10 months ago -
A ray of sunlight is passing from diamond into crown glass; the
angle of incidence is...
asked 10 months ago -
A block of mass 0.249 kg is placed on top of a light, vertical
spring of...
asked 10 months ago -
how do the kidneys compensate in the presences of acidosis
a) trigger hyperventilate
b) reserve acid...
asked 10 months ago -
Question 501 pts
The rental rate of capital to the firm increases. Which of the
following...
asked 10 months ago