After plotting my graph of q versus p for the lens with the longer focal length,...
After plotting my graph of q versus p for the lens with the longer focal length, how do I determine from the graph what the asymptotes are, and then use them to determine the two values for f (focal length) on the graph? Please be as detailed as possible and explain every step!
Table of original data
|
Position of Lens (cm) |
Position of Screen (cm) |
|
23.8 |
70.0 |
|
45.6 |
70.0 |
|
23.1 |
72.0 |
|
48.6 |
72.0 |
|
22.3 |
75.0 |
|
52.2 |
75.0 |
|
21.9 |
77.0 |
|
54.7 |
77.0 |
|
21.7 |
79.0 |
|
56.9 |
79.0 |
Homework Answers
I have to re arrange the given data as follows.
| Position of lens(cm) | Position of screen(cm) |
| 23.8 | 70 |
| 23.1 | 72 |
| 22.3 | 75 |
| 21.9 | 77 |
| 21.7 | 79 |
| 45.6 | 70 |
| 48.6 | 72 |
| 52.2 | 75 |
| 54.7 | 77 |
| 56.9 | 79 |
Plotted the graph as 2 data seris
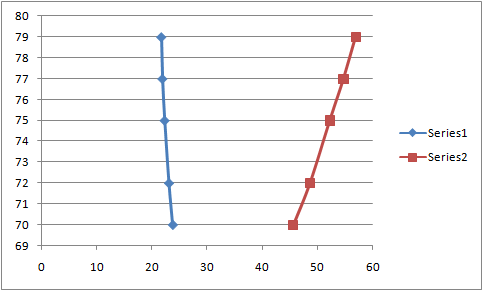
Both the curves are part of parabola
y = ax2 + bx+c
We don't know the value of a b or c.
Since we know the x and y values
I have formulated 3 equations for each curve
70= a 23.82+b 23.8 + 1*c 70 = 566.4 a + 23.8 b + 1c
72 = a 23.12 + b 23.1 + 1 c 72= 533.61 a + 23.1 b + 1c
75 = a 22.32 + b 22.3 + 1*c 75= 497.29 a+ 22.3 b + 1c
3 un knowns 3 equations we can solve the same
I used an online solver to solve the same
The a, b, c values are given below.
| a | 0.618812 |
| b | -31.8441 |
| c | 477.3936 |
Similarly i have found the data for the second group of data
70= a 45.62+b 45.6 + 1*c 70 = 2079.36 a + 45.6 b + 1c
72 = a 48.62 + b 48.6 + 1 c 72= 2361.96 a + 48.6 b + 1c
75 = a 52.22 + b 52.2 + 1*c 75= 2724.84 a+ 52.2 b + 1c
Solving we get
| a | 0.025253 |
| b | -1.71212 |
| c | 95.56364 |
Calculated the y values for 2 data as shown below
| Position of lens(cm) | Position of screen(cm) |
| 29 | 74.33663366 |
| 28 | 70.90841584 |
| 27 | 68.71782178 |
| 26 | 67.76485149 |
| 25 | 68.04950495 |
| 24 | 69.57178218 |
| 23.8 | 70 |
| 23.1 | 72 |
| 22.3 | 75 |
| 21.9 | 77 |
| 21.7 | 79 |
| 20 | 71.42222222 |
| 25 | 68.54343434 |
| 30 | 66.92727273 |
| 36 | 66.65454545 |
| 37 | 66.78585859 |
| 38 | 66.96767677 |
| 39 | 67.2 |
| 40 | 67.48282828 |
| 41 | 67.81616162 |
| 42 | 68.2 |
| 43 | 68.63434343 |
| 44 | 69.11919192 |
| 45.6 | 70 |
| 48.6 | 72 |
| 52.2 | 75 |
| 54.7 | 77 |
| 56.9 | 79 |
Ploting the graph yields

I have carefully joined the data
The point just before crossing for the first data set
| 24 | 69.57178218 |
For second data set
| 25 | 68.54343434 |
Rearranging the data gives the following details
| Position of lens(cm) | Position of screen(cm) |
| 21.7 | 79 |
| 21.9 | 77 |
| 22.3 | 75 |
| 23.1 | 72 |
| 23.8 | 70 |
| 24 | 69.57 |
| 25 | 68.54 |
| 30 | 66.93 |
| 36 | 66.65 |
| 37 | 66.79 |
| 38 | 66.97 |
| 39 | 67.20 |
| 40 | 67.48 |
| 41 | 67.82 |
| 42 | 68.20 |
| 43 | 68.63 |
| 44 | 69.12 |
| 45.6 | 70 |
| 48.6 | 72 |
| 52.2 | 75 |
| 54.7 | 77 |
| 56.9 | 79 |
focal length can be calculated by the below formulae for any data point u, v
u= position from lens
v = position from screen
f= u*v / (u+v)
for example
for the values
| 40 | 67.48 |
f= 40*67.48 / (40+67.48) = 25.11 cm
Hope this helps
Add Answer to:
After plotting my graph of q versus p for the lens with the
longer focal length,...
Hi I need help plotting this graph from my thin lenses lab. They want me to...
Hi I need help plotting this graph from my thin lenses lab. They want me to pick two sets of points from my data. The first set will become p1 and q1 and the second set will become p2 and q2. Plot q1 and p1, and q2 and p2 on the same graph. (Hint: select values of p1 and p2 such that the difference between them is at least 30cm.) I'm using this to find the the intersection of the...
A diverging lens has a focal length of 20.0 cm. Use graph paper to construct accurate...
A diverging lens has a focal length of 20.0 cm. Use graph paper to construct accurate ray diagrams for object distances of 40.0 cm and 10.0 cm. Please draw ray diagrams for a and b and c and include them in your submission. (a) For the 40.0-cm case, determine the location of the image from the diagram and the image magnification, and state whether the image is upright or inverted. (b) For the 10.0-cm case, determine the location of the...
9. -15 points KatzPSE1 38.P.076 My Notes Ask Your The figure below shows an object placed a distance doi from one of two converging lenses separated by s 1.00 m. The first lens has focal length fi 23...
 9. -15 points KatzPSE1 38.P.076 My Notes Ask Your The figure below shows an object placed a distance doi from one of two converging lenses separated by s 1.00 m. The first lens has focal length fi 23.0 cm, and the second lens has focal length 2 47.0 cm. An image is formed by light passing through both lenses at a distance = 12.0 cm to the left of the second lens. Include the sign of the value in your...
 9. -15 points KatzPSE1 38.P.076 My Notes Ask Your The figure below shows an object placed a distance doi from one of two converging lenses separated by s 1.00 m. The first lens has focal length fi 23.0 cm, and the second lens has focal length 2 47.0 cm. An image is formed by light passing through both lenses at a distance = 12.0 cm to the left of the second lens. Include the sign of the value in your...
Most questions answered within 3 hours.
-
Where is the error in this code sequence?
String s1 = "Hello";
String s2 = "ello";...
asked 10 months ago -
Financial data for Joel de Paris, Inc., for last year
follow:
Joel de Paris, Inc.
Balance...
asked 10 months ago -
Consider this reaction:
Al2(SO4)3 (aq)+ BaCl3
(aq) Al2Cl6 (aq)- +
3BaSO4(s) . What is the...
asked 10 months ago -
Suppose that Savneet is considering increasing her
recent random sample from 20 car rentals to 40...
asked 10 months ago -
Trucks arrive at an unloading terminal at an average rate of 120
per hour.
Trucks arrive...
asked 10 months ago -
Why are methanol and ethanol completely soluble in water while
octanol is not very little soluble....
asked 10 months ago -
A facilities manager at a university reads in a research report
that the mean amount of...
asked 10 months ago -
When the CuSO4 is rehydrated by adding water to the anhydrous
compound, is this an endothermic...
asked 10 months ago -
A ray of sunlight is passing from diamond into crown glass; the
angle of incidence is...
asked 10 months ago -
A block of mass 0.249 kg is placed on top of a light, vertical
spring of...
asked 10 months ago -
how do the kidneys compensate in the presences of acidosis
a) trigger hyperventilate
b) reserve acid...
asked 10 months ago -
Question 501 pts
The rental rate of capital to the firm increases. Which of the
following...
asked 10 months ago