
Homework Answers
Normal Probability plot:

----------------------------------
Skewed Probability plot:
----------------------------------
Not normal but symmetric probability plot:

Add Answer to:
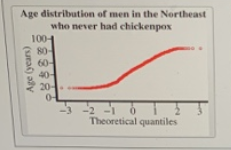
Classify each normal probability plot as normal, skewed, or not normal but symmetric. Normal Skewed Not...
is this right-skewed, left-skewed, symmetric or uniform? Longevity 20 40 80 100 60 Longevity
 is this right-skewed, left-skewed, symmetric or uniform?
Longevity 20 40 80 100 60 Longevity
is this right-skewed, left-skewed, symmetric or uniform?
Longevity 20 40 80 100 60 Longevity
[1] Use JMP to construct a histogram and box-plot for the variable Receipt Total. [2] Describe the shape of the distribution. Is the distribution roughly symmetric or skewed in a direction? [3] Does t...
[1] Use JMP to construct a histogram and box-plot for the variable Receipt Total. [2] Describe the shape of the distribution. Is the distribution roughly symmetric or skewed in a direction? [3] Does the distribution have any outliers? If so, how many and what are the values? [4] Use JMP to construct a Quantiles table. Paste the quantiles table in the left-hand box and enter the values that make up the five-number summary on the right. maximum 75% quartile median...
asap please 4. Consider the boxplot shown below of the points earned on the 124 points...
 asap please
4. Consider the boxplot shown below of the points earned on the 124 points of problems on the Fall 2018 STA2220 final exam for the 108 students in the 3 Tuesday/Thursday sections: -++Points o 10 20 30 40 50 60 70 80 90 100 110 120 130 (2 a) Describe the distribution as symmetric, left-skewed, or right-skewed. (2) b) About what proportion of the students scored at least half of the points possible on these problems? CS) c)...
asap please
4. Consider the boxplot shown below of the points earned on the 124 points of problems on the Fall 2018 STA2220 final exam for the 108 students in the 3 Tuesday/Thursday sections: -++Points o 10 20 30 40 50 60 70 80 90 100 110 120 130 (2 a) Describe the distribution as symmetric, left-skewed, or right-skewed. (2) b) About what proportion of the students scored at least half of the points possible on these problems? CS) c)...
ASAP PLEASE 4. Consider the boxplot shown below of the points earned on the 124 points...
 ASAP PLEASE
4. Consider the boxplot shown below of the points earned on the 124 points of problems on the Fall 2018 STA2220 final exam for the 108 students in the 3 Tuesday/Thursday sections: -++Points o 10 20 30 40 50 60 70 80 90 100 110 120 130 (2 a) Describe the distribution as symmetric, left-skewed, or right-skewed. (2) b) About what proportion of the students scored at least half of the points possible on these problems? CS) c)...
ASAP PLEASE
4. Consider the boxplot shown below of the points earned on the 124 points of problems on the Fall 2018 STA2220 final exam for the 108 students in the 3 Tuesday/Thursday sections: -++Points o 10 20 30 40 50 60 70 80 90 100 110 120 130 (2 a) Describe the distribution as symmetric, left-skewed, or right-skewed. (2) b) About what proportion of the students scored at least half of the points possible on these problems? CS) c)...
asap please 4. Consider the boxplot shown below of the points earned on the 124 points...
 asap please
4. Consider the boxplot shown below of the points earned on the 124 points of problems on the Fall 2018 STA2220 final exam for the 108 students in the 3 Tuesday/Thursday sections: -++Points o 10 20 30 40 50 60 70 80 90 100 110 120 130 (2 a) Describe the distribution as symmetric, left-skewed, or right-skewed. (2) b) About what proportion of the students scored at least half of the points possible on these problems? CS) c)...
asap please
4. Consider the boxplot shown below of the points earned on the 124 points of problems on the Fall 2018 STA2220 final exam for the 108 students in the 3 Tuesday/Thursday sections: -++Points o 10 20 30 40 50 60 70 80 90 100 110 120 130 (2 a) Describe the distribution as symmetric, left-skewed, or right-skewed. (2) b) About what proportion of the students scored at least half of the points possible on these problems? CS) c)...
question 2 & 3 please 4. Consider the boxplot shown below of the points earned on...
 question 2 & 3 please
4. Consider the boxplot shown below of the points earned on the 124 points of problems on the Fall 2018 STA2220 final exam for the 108 students in the 3 Tuesday/Thursday sections: -++Points o 10 20 30 40 50 60 70 80 90 100 110 120 130 (2 a) Describe the distribution as symmetric, left-skewed, or right-skewed. (2) b) About what proportion of the students scored at least half of the points possible on these...
question 2 & 3 please
4. Consider the boxplot shown below of the points earned on the 124 points of problems on the Fall 2018 STA2220 final exam for the 108 students in the 3 Tuesday/Thursday sections: -++Points o 10 20 30 40 50 60 70 80 90 100 110 120 130 (2 a) Describe the distribution as symmetric, left-skewed, or right-skewed. (2) b) About what proportion of the students scored at least half of the points possible on these...
At the Horton College of Engineering, Engineering students and Physics students took a math exam. Their...
 At the Horton College of Engineering, Engineering students and Physics students took a math exam. Their scores were used to make side-by-side boxplots. Answer the following questions: 1. Engineering o Physics 20 30 40 50 60 70 80 90 100 (1) What is the interquartile range among the physics students? (2) How low of a score on the exam would an engineering student need in order to be considered as an outlier? (3) Based on the boxplots, what is the...
QUESTION 1 The normal curve is particularly useful as a model for a. data in which...
QUESTION 1 The normal curve is particularly useful as a model for a. data in which mean and median differ b. many populations of psychological and educational data c. distributions of sample statistics d. both (b) and (c) above QUESTION 2 A distribution has a mean of 60 and a standard deviation of 8. For a score of 72, the equivalent z score a. is +1.5 b. is between 0 and +1.0 c. is + 1.2 d. cannot be determined...
R studio #Exercise : Calculate the following probabilities : #1. Probability that a normal random variable...
R studio #Exercise : Calculate the following probabilities : #1. Probability that a normal random variable with mean 22 and variance 25 #(i)lies between 16.2 and 27.5 #(ii) is greater than 29 #(iii) is less than 17 #(iv)is less than 15 or greater than 25 #2.Probability that in 60 tosses of a fair coin the head comes up #(i) 20,25 or 30 times #(ii) less than 20 times #(iii) between 20 and 30 times #3.A random variable X has Poisson...
Questions 7-10 refer to the following: The heights (in cm) of a sample of plants grown...
 Questions 7-10 refer to the following: The heights (in cm) of a sample of plants grown with different fertilizers (or no fertilizer) are summarized in the side-by-side quantile boxplots shown below. A numerical summary of each 40 30 20 10 0 No Fertilizer GrowFast SuperPlant n min Q1 median Q3 max meand dev 30 3 14 21 25 28 18.8 6.1 GrowFast 25 12 18 23 28 35 23.2 4.3 SuperPlant 20 15 19 23 30 38 25.3 52 No...
 is this right-skewed, left-skewed, symmetric or uniform?
Longevity 20 40 80 100 60 Longevity
is this right-skewed, left-skewed, symmetric or uniform?
Longevity 20 40 80 100 60 Longevity
 asap please
4. Consider the boxplot shown below of the points earned on the 124 points of problems on the Fall 2018 STA2220 final exam for the 108 students in the 3 Tuesday/Thursday sections: -++Points o 10 20 30 40 50 60 70 80 90 100 110 120 130 (2 a) Describe the distribution as symmetric, left-skewed, or right-skewed. (2) b) About what proportion of the students scored at least half of the points possible on these problems? CS) c)...
asap please
4. Consider the boxplot shown below of the points earned on the 124 points of problems on the Fall 2018 STA2220 final exam for the 108 students in the 3 Tuesday/Thursday sections: -++Points o 10 20 30 40 50 60 70 80 90 100 110 120 130 (2 a) Describe the distribution as symmetric, left-skewed, or right-skewed. (2) b) About what proportion of the students scored at least half of the points possible on these problems? CS) c)...
 ASAP PLEASE
4. Consider the boxplot shown below of the points earned on the 124 points of problems on the Fall 2018 STA2220 final exam for the 108 students in the 3 Tuesday/Thursday sections: -++Points o 10 20 30 40 50 60 70 80 90 100 110 120 130 (2 a) Describe the distribution as symmetric, left-skewed, or right-skewed. (2) b) About what proportion of the students scored at least half of the points possible on these problems? CS) c)...
ASAP PLEASE
4. Consider the boxplot shown below of the points earned on the 124 points of problems on the Fall 2018 STA2220 final exam for the 108 students in the 3 Tuesday/Thursday sections: -++Points o 10 20 30 40 50 60 70 80 90 100 110 120 130 (2 a) Describe the distribution as symmetric, left-skewed, or right-skewed. (2) b) About what proportion of the students scored at least half of the points possible on these problems? CS) c)...
 asap please
4. Consider the boxplot shown below of the points earned on the 124 points of problems on the Fall 2018 STA2220 final exam for the 108 students in the 3 Tuesday/Thursday sections: -++Points o 10 20 30 40 50 60 70 80 90 100 110 120 130 (2 a) Describe the distribution as symmetric, left-skewed, or right-skewed. (2) b) About what proportion of the students scored at least half of the points possible on these problems? CS) c)...
asap please
4. Consider the boxplot shown below of the points earned on the 124 points of problems on the Fall 2018 STA2220 final exam for the 108 students in the 3 Tuesday/Thursday sections: -++Points o 10 20 30 40 50 60 70 80 90 100 110 120 130 (2 a) Describe the distribution as symmetric, left-skewed, or right-skewed. (2) b) About what proportion of the students scored at least half of the points possible on these problems? CS) c)...
 question 2 & 3 please
4. Consider the boxplot shown below of the points earned on the 124 points of problems on the Fall 2018 STA2220 final exam for the 108 students in the 3 Tuesday/Thursday sections: -++Points o 10 20 30 40 50 60 70 80 90 100 110 120 130 (2 a) Describe the distribution as symmetric, left-skewed, or right-skewed. (2) b) About what proportion of the students scored at least half of the points possible on these...
question 2 & 3 please
4. Consider the boxplot shown below of the points earned on the 124 points of problems on the Fall 2018 STA2220 final exam for the 108 students in the 3 Tuesday/Thursday sections: -++Points o 10 20 30 40 50 60 70 80 90 100 110 120 130 (2 a) Describe the distribution as symmetric, left-skewed, or right-skewed. (2) b) About what proportion of the students scored at least half of the points possible on these...
 At the Horton College of Engineering, Engineering students and Physics students took a math exam. Their scores were used to make side-by-side boxplots. Answer the following questions: 1. Engineering o Physics 20 30 40 50 60 70 80 90 100 (1) What is the interquartile range among the physics students? (2) How low of a score on the exam would an engineering student need in order to be considered as an outlier? (3) Based on the boxplots, what is the...
 Questions 7-10 refer to the following: The heights (in cm) of a sample of plants grown with different fertilizers (or no fertilizer) are summarized in the side-by-side quantile boxplots shown below. A numerical summary of each 40 30 20 10 0 No Fertilizer GrowFast SuperPlant n min Q1 median Q3 max meand dev 30 3 14 21 25 28 18.8 6.1 GrowFast 25 12 18 23 28 35 23.2 4.3 SuperPlant 20 15 19 23 30 38 25.3 52 No...
Most questions answered within 3 hours.
-
Where is the error in this code sequence?
String s1 = "Hello";
String s2 = "ello";...
asked 10 months ago -
Financial data for Joel de Paris, Inc., for last year
follow:
Joel de Paris, Inc.
Balance...
asked 10 months ago -
Consider this reaction:
Al2(SO4)3 (aq)+ BaCl3
(aq) Al2Cl6 (aq)- +
3BaSO4(s) . What is the...
asked 10 months ago -
Suppose that Savneet is considering increasing her
recent random sample from 20 car rentals to 40...
asked 10 months ago -
Trucks arrive at an unloading terminal at an average rate of 120
per hour.
Trucks arrive...
asked 10 months ago -
Why are methanol and ethanol completely soluble in water while
octanol is not very little soluble....
asked 10 months ago -
A facilities manager at a university reads in a research report
that the mean amount of...
asked 10 months ago -
When the CuSO4 is rehydrated by adding water to the anhydrous
compound, is this an endothermic...
asked 10 months ago -
A ray of sunlight is passing from diamond into crown glass; the
angle of incidence is...
asked 10 months ago -
A block of mass 0.249 kg is placed on top of a light, vertical
spring of...
asked 10 months ago -
how do the kidneys compensate in the presences of acidosis
a) trigger hyperventilate
b) reserve acid...
asked 10 months ago -
Question 501 pts
The rental rate of capital to the firm increases. Which of the
following...
asked 10 months ago