Two types of flares are tested and their burning times (in minutes) are recorded. The summary...
Two types of flares are tested and their burning times (in minutes) are recorded. The summary statistics are given below. Use a 0.05 significance level to test the claim that the two samples are from populations with the same mean. Identify the null and alternative hypotheses.
Brand X: ??=??.?, ??=?? , ?=?.?
Brand Y: ??=??.? ??=?? , ?=?.?
My problem is that I forget how to find and calculate such as TA/2 which I supposed to do next steps for E. So, I know the question is for ??−??−?<??−??<??−??+?. I finished calculator to find T formulas. the T is 16.025. I am stuck with my step for solution.
Homework Answers

Add Answer to:
Two types of flares are tested and their burning times (in
minutes) are recorded. The summary...
Test the indicated claim about the means of two populations. Assume that the two samples are...
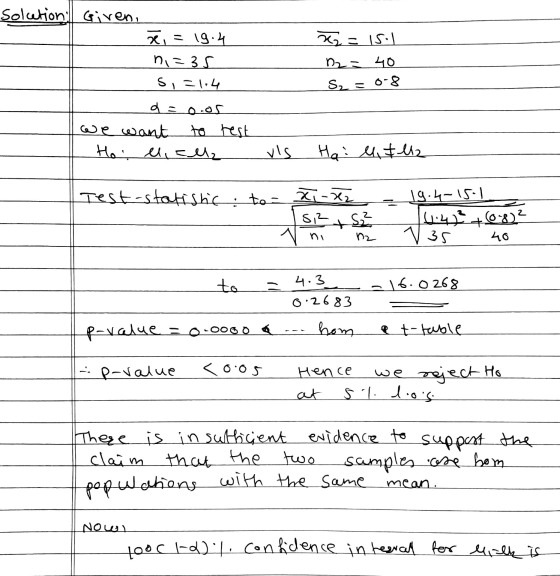
 Test the indicated claim about the means of two populations. Assume that the two samples are independent an have been randomly selected. 3) Two types of flares are tested for their burning times (in minutes) and sample results are 3). given below. Brand X Brand Y n=35 n = 40 x = 19.4 x = 15.1 s = 1.4 s 0.8 Refer to the sample data to test the claim that the two populations have equal means. Use a 0.05...
hi can you please help me find the claim two samples are independent and that they...
 hi
can you please help me find the claim
two samples are independent and that they Test the indicated claim about the means of two populations. Assume that the two have been randomly selected. 3) Two types of flares are tested for their burning times in minutes) and sample results given below. times (in minutes) and sample results are 3) Brand X Brand Y n=35 n 40 * = 19.4 x = 15.1 8-14 $ 0.8 Refer to the sample...
hi
can you please help me find the claim
two samples are independent and that they Test the indicated claim about the means of two populations. Assume that the two have been randomly selected. 3) Two types of flares are tested for their burning times in minutes) and sample results given below. times (in minutes) and sample results are 3) Brand X Brand Y n=35 n 40 * = 19.4 x = 15.1 8-14 $ 0.8 Refer to the sample...
can you please help me with the graph thanks Test the indicated claim about the mea...
 can you please help me with the graph thanks
Test the indicated claim about the mea have been randomly selected. dicated claim about the means of two populations. Assume that the two samples are made he two samples are independent and that they 3) Two types of flares are tested for their burning times (in minutes) and sample results are given below. Brand Y n=40 Brand X n = 35 x= 19.4 s= 1.4 x = 15.1 s=0.8 Sxe 1...
can you please help me with the graph thanks
Test the indicated claim about the mea have been randomly selected. dicated claim about the means of two populations. Assume that the two samples are made he two samples are independent and that they 3) Two types of flares are tested for their burning times (in minutes) and sample results are given below. Brand Y n=40 Brand X n = 35 x= 19.4 s= 1.4 x = 15.1 s=0.8 Sxe 1...
Question 16 4 pts Test the indicated daim about the means of two populations. Assume that...
 Question 16 4 pts Test the indicated daim about the means of two populations. Assume that the two samples are independent simple random samples selected from normally distributed populations Two types of flares are tested and their burning times in minutes are recorded. The summary statistics are given below. Use any method to determine if there is a significant difference in the burning times of the flares using a significance level of 0.05. Beady Brand X n-1 40 1-0 min...
hi how do you get the t value in the cal ti83 Test the indicated claim...
 hi
how do you get the t value in the cal ti83
Test the indicated claim about the means of two populations. Assume that the two samples are independent and that they have been randomly selected. 3) Two types of flares are tested for their burning times (in minutes) and sample results are 3 given below. Brand X n35 x=19.4 $ 1.4 Brand Y n = 40 x 15.1 S0.8 Refer to the sample data to test the claim that...
hi
how do you get the t value in the cal ti83
Test the indicated claim about the means of two populations. Assume that the two samples are independent and that they have been randomly selected. 3) Two types of flares are tested for their burning times (in minutes) and sample results are 3 given below. Brand X n35 x=19.4 $ 1.4 Brand Y n = 40 x 15.1 S0.8 Refer to the sample data to test the claim that...
Please answer all ET ANSWER. Write the word or phrase that best completes each statement on...
 Please answer all
ET ANSWER. Write the word or phrase that best completes each statement on answers the question. indicated claim about the means of twe populations. Assume that the two samples are independent siempl qual. Use the traditional method or P-value method as indicated est the random sampl ples selected from normally distributed populations. Do not assunme that the pepalation Mandard deviation types of flares are tested and their burning times (in minutes) are recorded. The summary statisties are...
Please answer all
ET ANSWER. Write the word or phrase that best completes each statement on answers the question. indicated claim about the means of twe populations. Assume that the two samples are independent siempl qual. Use the traditional method or P-value method as indicated est the random sampl ples selected from normally distributed populations. Do not assunme that the pepalation Mandard deviation types of flares are tested and their burning times (in minutes) are recorded. The summary statisties are...
Provided below are summary statistics for independent simple random samples from two populations. Use the pooled...
Provided below are summary statistics for independent simple random samples from two populations. Use the pooled t-test and the pooled t-interval procedure to conduct the required hypothesis test and obtain the specified confidence interval. x overbar 1 = 11, s 1 = 2.4, n 1=10, x overbar 2= 14, s 2= 2.2, n 2= 10 a. Two-tailed test, alpha =0.05 b. 95% confidence interval (can you please show me how to input it onto calculator) ( I need help finding...
section 10.3 Provided below are summary statistics for independent simple random samples from two populations. Use...
 section 10.3
Provided below are summary statistics for independent simple random samples from two populations. Use the nonpooled t-test and the nonpooled t-interval procedure to conduct the required hypothesis test and obtain the specified confidence interval X = 10,8, +2, ny = 20, X2 = 11,62 = 5, n2 = 20 a. Two-tailed test, 0.01 b. 99% confidence interval a. What are the hypotheses for the t-test? O A. Ho: H=12 Haith Oc. Ho: * HOW 2 B. HeH=2 HHH2...
section 10.3
Provided below are summary statistics for independent simple random samples from two populations. Use the nonpooled t-test and the nonpooled t-interval procedure to conduct the required hypothesis test and obtain the specified confidence interval X = 10,8, +2, ny = 20, X2 = 11,62 = 5, n2 = 20 a. Two-tailed test, 0.01 b. 99% confidence interval a. What are the hypotheses for the t-test? O A. Ho: H=12 Haith Oc. Ho: * HOW 2 B. HeH=2 HHH2...
section 10.3 Provided below are summary statistics for independent simple random samples from two populations. Use...
 section 10.3
Provided below are summary statistics for independent simple random samples from two populations. Use the nonpooled t-test and the nonpooled t-interval procedure to conduct the required hypothesis test and obtain the specified confidence interval. *4 = 10,5 - 2, 0, -20, 72 - 11,5 - 5, n2 - 20 a. Two-tailed test, a = 0.01 b. 99% confidence interval a. What are the hypotheses for the t-test? O A HOHH2 H₂H12 Oc. Ho: H = 12 Hai H1...
section 10.3
Provided below are summary statistics for independent simple random samples from two populations. Use the nonpooled t-test and the nonpooled t-interval procedure to conduct the required hypothesis test and obtain the specified confidence interval. *4 = 10,5 - 2, 0, -20, 72 - 11,5 - 5, n2 - 20 a. Two-tailed test, a = 0.01 b. 99% confidence interval a. What are the hypotheses for the t-test? O A HOHH2 H₂H12 Oc. Ho: H = 12 Hai H1...
The burning rates of two different solid-fuel propellants used in aircrew escape systems are being studied....
The burning rates of two different solid-fuel propellants used in aircrew escape systems are being studied. It is known that both propellants have approximately the same standard deviation of burning rate; that is, = = 3cm/s. Two random samples of = 20 and = 20 specimens are tested; the sample mean burning rates are = 18.02cm/s and = 24.37cm/s. Test the hypothesis that both propellants have the same mean burning rate. Use a fixed level test with α= 0.05. To...
 Test the indicated claim about the means of two populations. Assume that the two samples are independent an have been randomly selected. 3) Two types of flares are tested for their burning times (in minutes) and sample results are 3). given below. Brand X Brand Y n=35 n = 40 x = 19.4 x = 15.1 s = 1.4 s 0.8 Refer to the sample data to test the claim that the two populations have equal means. Use a 0.05...
 hi
can you please help me find the claim
two samples are independent and that they Test the indicated claim about the means of two populations. Assume that the two have been randomly selected. 3) Two types of flares are tested for their burning times in minutes) and sample results given below. times (in minutes) and sample results are 3) Brand X Brand Y n=35 n 40 * = 19.4 x = 15.1 8-14 $ 0.8 Refer to the sample...
hi
can you please help me find the claim
two samples are independent and that they Test the indicated claim about the means of two populations. Assume that the two have been randomly selected. 3) Two types of flares are tested for their burning times in minutes) and sample results given below. times (in minutes) and sample results are 3) Brand X Brand Y n=35 n 40 * = 19.4 x = 15.1 8-14 $ 0.8 Refer to the sample...
 can you please help me with the graph thanks
Test the indicated claim about the mea have been randomly selected. dicated claim about the means of two populations. Assume that the two samples are made he two samples are independent and that they 3) Two types of flares are tested for their burning times (in minutes) and sample results are given below. Brand Y n=40 Brand X n = 35 x= 19.4 s= 1.4 x = 15.1 s=0.8 Sxe 1...
can you please help me with the graph thanks
Test the indicated claim about the mea have been randomly selected. dicated claim about the means of two populations. Assume that the two samples are made he two samples are independent and that they 3) Two types of flares are tested for their burning times (in minutes) and sample results are given below. Brand Y n=40 Brand X n = 35 x= 19.4 s= 1.4 x = 15.1 s=0.8 Sxe 1...
 Question 16 4 pts Test the indicated daim about the means of two populations. Assume that the two samples are independent simple random samples selected from normally distributed populations Two types of flares are tested and their burning times in minutes are recorded. The summary statistics are given below. Use any method to determine if there is a significant difference in the burning times of the flares using a significance level of 0.05. Beady Brand X n-1 40 1-0 min...
 hi
how do you get the t value in the cal ti83
Test the indicated claim about the means of two populations. Assume that the two samples are independent and that they have been randomly selected. 3) Two types of flares are tested for their burning times (in minutes) and sample results are 3 given below. Brand X n35 x=19.4 $ 1.4 Brand Y n = 40 x 15.1 S0.8 Refer to the sample data to test the claim that...
hi
how do you get the t value in the cal ti83
Test the indicated claim about the means of two populations. Assume that the two samples are independent and that they have been randomly selected. 3) Two types of flares are tested for their burning times (in minutes) and sample results are 3 given below. Brand X n35 x=19.4 $ 1.4 Brand Y n = 40 x 15.1 S0.8 Refer to the sample data to test the claim that...
 Please answer all
ET ANSWER. Write the word or phrase that best completes each statement on answers the question. indicated claim about the means of twe populations. Assume that the two samples are independent siempl qual. Use the traditional method or P-value method as indicated est the random sampl ples selected from normally distributed populations. Do not assunme that the pepalation Mandard deviation types of flares are tested and their burning times (in minutes) are recorded. The summary statisties are...
Please answer all
ET ANSWER. Write the word or phrase that best completes each statement on answers the question. indicated claim about the means of twe populations. Assume that the two samples are independent siempl qual. Use the traditional method or P-value method as indicated est the random sampl ples selected from normally distributed populations. Do not assunme that the pepalation Mandard deviation types of flares are tested and their burning times (in minutes) are recorded. The summary statisties are...
 section 10.3
Provided below are summary statistics for independent simple random samples from two populations. Use the nonpooled t-test and the nonpooled t-interval procedure to conduct the required hypothesis test and obtain the specified confidence interval X = 10,8, +2, ny = 20, X2 = 11,62 = 5, n2 = 20 a. Two-tailed test, 0.01 b. 99% confidence interval a. What are the hypotheses for the t-test? O A. Ho: H=12 Haith Oc. Ho: * HOW 2 B. HeH=2 HHH2...
section 10.3
Provided below are summary statistics for independent simple random samples from two populations. Use the nonpooled t-test and the nonpooled t-interval procedure to conduct the required hypothesis test and obtain the specified confidence interval X = 10,8, +2, ny = 20, X2 = 11,62 = 5, n2 = 20 a. Two-tailed test, 0.01 b. 99% confidence interval a. What are the hypotheses for the t-test? O A. Ho: H=12 Haith Oc. Ho: * HOW 2 B. HeH=2 HHH2...
 section 10.3
Provided below are summary statistics for independent simple random samples from two populations. Use the nonpooled t-test and the nonpooled t-interval procedure to conduct the required hypothesis test and obtain the specified confidence interval. *4 = 10,5 - 2, 0, -20, 72 - 11,5 - 5, n2 - 20 a. Two-tailed test, a = 0.01 b. 99% confidence interval a. What are the hypotheses for the t-test? O A HOHH2 H₂H12 Oc. Ho: H = 12 Hai H1...
section 10.3
Provided below are summary statistics for independent simple random samples from two populations. Use the nonpooled t-test and the nonpooled t-interval procedure to conduct the required hypothesis test and obtain the specified confidence interval. *4 = 10,5 - 2, 0, -20, 72 - 11,5 - 5, n2 - 20 a. Two-tailed test, a = 0.01 b. 99% confidence interval a. What are the hypotheses for the t-test? O A HOHH2 H₂H12 Oc. Ho: H = 12 Hai H1...
Most questions answered within 3 hours.
-
Where is the error in this code sequence?
String s1 = "Hello";
String s2 = "ello";...
asked 10 months ago -
Financial data for Joel de Paris, Inc., for last year
follow:
Joel de Paris, Inc.
Balance...
asked 10 months ago -
Consider this reaction:
Al2(SO4)3 (aq)+ BaCl3
(aq) Al2Cl6 (aq)- +
3BaSO4(s) . What is the...
asked 10 months ago -
Suppose that Savneet is considering increasing her
recent random sample from 20 car rentals to 40...
asked 10 months ago -
Trucks arrive at an unloading terminal at an average rate of 120
per hour.
Trucks arrive...
asked 10 months ago -
Why are methanol and ethanol completely soluble in water while
octanol is not very little soluble....
asked 10 months ago -
A facilities manager at a university reads in a research report
that the mean amount of...
asked 10 months ago -
When the CuSO4 is rehydrated by adding water to the anhydrous
compound, is this an endothermic...
asked 10 months ago -
A ray of sunlight is passing from diamond into crown glass; the
angle of incidence is...
asked 10 months ago -
A block of mass 0.249 kg is placed on top of a light, vertical
spring of...
asked 10 months ago -
how do the kidneys compensate in the presences of acidosis
a) trigger hyperventilate
b) reserve acid...
asked 10 months ago -
Question 501 pts
The rental rate of capital to the firm increases. Which of the
following...
asked 10 months ago