Construct a linear regression model that uses a person's BMI to predict their LDL level. Round...
Construct a linear regression model that uses a person's BMI to predict their LDL level. Round the model's coefficients to three decimal places; add trailing zeros as needed.
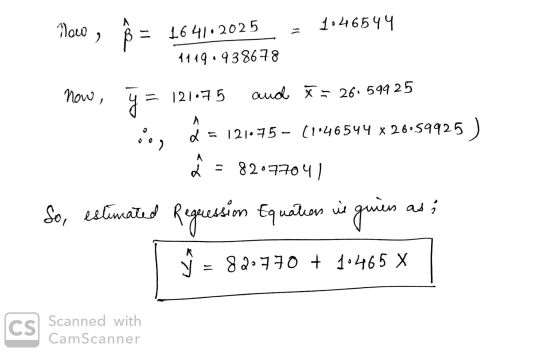
The regression model is ŷ = + x
BMI LDL
20.14 213 ""
19.62 88 ""
22.26 174 ""
29.04 121 ""
22.14 124 ""
20.48 99 ""
38.45 114 ""
23.8 122 ""
20.82 112 ""
17.27 67 ""
26.46 108 ""
34.45 94 ""
20.37 69 ""
25.61 77 ""
33.89 120 ""
28.17 84 ""
33.21 86 ""
20.34 77 ""
29.4 201 ""
26.33 196 ""
29.71 179 ""
29.46 140 ""
20.52 117 ""
21.65 117 ""
17.84 87 ""
26.6 78 ""
28.21 159 ""
27.96 113 ""
36.75 155 ""
21.79 85 ""
32.38 90 ""
33.27 104 ""
30.95 154 ""
26.45 114 ""
27.86 156 ""
27.08 103 ""
32.28 145 ""
25 135 ""
26.13 123 ""
29.83 170 ""
Homework Answers

Add Answer to:
Construct a linear regression model that uses a person's BMI to
predict their LDL level. Round...
Question 7 (Use Data Set 1) a. If the heights of men and women from Data Set 1 in Appendix B are ...
 Question 7 (Use Data Set 1) a. If the heights of men and women from Data Set 1 in Appendix B are used to construct a 95% confidence interval for the difference between the two population means, the result is 11.61 cm < μ1-μ2 <17.32 cm, where heights of men correspond to population 1 and heights of women correspond to population 2. Express the confidence interval with heights of women being population 1 and heights of men being population 2....
 Question 7 (Use Data Set 1) a. If the heights of men and women from Data Set 1 in Appendix B are used to construct a 95% confidence interval for the difference between the two population means, the result is 11.61 cm < μ1-μ2 <17.32 cm, where heights of men correspond to population 1 and heights of women correspond to population 2. Express the confidence interval with heights of women being population 1 and heights of men being population 2....
Most questions answered within 3 hours.
-
Where is the error in this code sequence?
String s1 = "Hello";
String s2 = "ello";...
asked 10 months ago -
Financial data for Joel de Paris, Inc., for last year
follow:
Joel de Paris, Inc.
Balance...
asked 10 months ago -
Consider this reaction:
Al2(SO4)3 (aq)+ BaCl3
(aq) Al2Cl6 (aq)- +
3BaSO4(s) . What is the...
asked 10 months ago -
Suppose that Savneet is considering increasing her
recent random sample from 20 car rentals to 40...
asked 10 months ago -
Trucks arrive at an unloading terminal at an average rate of 120
per hour.
Trucks arrive...
asked 10 months ago -
Why are methanol and ethanol completely soluble in water while
octanol is not very little soluble....
asked 10 months ago -
A facilities manager at a university reads in a research report
that the mean amount of...
asked 10 months ago -
When the CuSO4 is rehydrated by adding water to the anhydrous
compound, is this an endothermic...
asked 10 months ago -
A ray of sunlight is passing from diamond into crown glass; the
angle of incidence is...
asked 10 months ago -
A block of mass 0.249 kg is placed on top of a light, vertical
spring of...
asked 10 months ago -
how do the kidneys compensate in the presences of acidosis
a) trigger hyperventilate
b) reserve acid...
asked 10 months ago -
Question 501 pts
The rental rate of capital to the firm increases. Which of the
following...
asked 10 months ago