
Homework Answers

SOLUTION :
a.
p = f(x)
E(x)
= ∑ f(x) * x
= 0.4*0 + 0.3*1 + 0.2*2 + 0.1*3
= 1.0 company / day (ANSWER).
b.
Variance
= ∑ f(f)( x - E(x))^2
= 0.4(0 - 1)^2 + 0.3(1 - 1)^2 + 0.2(2 - 1)^2 + 0.1(3 - 1)^2
= 0.4 + 0 + 0.2 + 0.4
= 1.0
So,
SD
= sqrt(Variance)
= sqrt(1.0)
= 1.0 company / day (ANSWER).
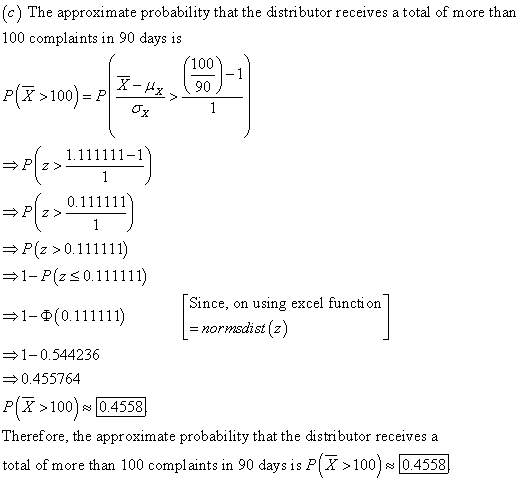
c.
Company per day = 100/90 = 10/9
P(x > 10/9)
= P(z > (10/9 - 1)/ 1)
= P(z > 0.1111)
From ND table
= 1 - 0.5442
= 0.4558 (ANSWER).
Add Answer to:
The number of complaints per day, X, received by a cable TV distributor has the probability...
A used-car dealer gets complaints about his cars as shown in the table. Number of complaints per day 1 2 3 4 5 6 0.01 0.04 0.13 0.21 0.41 0.14 0.06 Probability Find the expected number of complaints...
 A used-car dealer gets complaints about his cars as shown in the table. Number of complaints per day 1 2 3 4 5 6 0.01 0.04 0.13 0.21 0.41 0.14 0.06 Probability Find the expected number of complaints per day The expected number of complaints per day is (Type an integer or a decimal. Do not round your answer.)
A used-car dealer gets complaints about his cars as shown in the table. Number of complaints per day 1 2 3...
A used-car dealer gets complaints about his cars as shown in the table. Number of complaints per day 1 2 3 4 5 6 0.01 0.04 0.13 0.21 0.41 0.14 0.06 Probability Find the expected number of complaints per day The expected number of complaints per day is (Type an integer or a decimal. Do not round your answer.)
A used-car dealer gets complaints about his cars as shown in the table. Number of complaints per day 1 2 3...
A department store manager has monitored the number of complaints received per week about poor service....
A department store manager has monitored the number of complaints received per week about poor service. The probabilities for numbers of complaints in a week, established by this review, are shown in the table. Number of complaints 0 1 2 3 4 5 Probability 0.19 0.21 0.41 0.05 0.08 0.06 What is the standard deviation of complaints received per week?
A professor keeps tracks of student complaints received each week. The probability distribution for complaints can...
A professor keeps tracks of student complaints received each week. The probability distribution for complaints can be represented as the table shown below. The random variable xi represents the number of complaints, and p( xi) is the probability of receiving xi complaints. xi 0 1 2 3 4 5 6 p(xi) .1 .1 .15 .15 .15 .2 .15 What is the average number of complaints received per week? 3.35 2.83 4.12 2.12
A department store manager has monitored the number of complaints received per week about poor service....
A department store manager has monitored the number of complaints received per week about poor service. The probabilities for numbers of complaints in a week, established by this review, are shown in the table. Number of complaints 0 1 2 3 4 5 Probability 0.16 0.26 0.35 0.10 0.08 0.05 What is the probability of between 3 and 5 (inclusive) complaints received per week? Please specify your answer in decimal terms and round your answer to the nearest hundredth (e.g.,...
A department store manager has monitored the number of complaints received per week about poor service....
A department store manager has monitored the number of complaints received per week about poor service. The probabilities for numbers of complaints in a week, established by this review, are shown in the table. Number of complaints 0 1 2 3 4 5 Probability 0.17 0.30 0.33 0.07 0.05 0.08 What is the mean of complaints received per week?
A department store manager has monitored the number of complaints received per week about poor service....
A department store manager has monitored the number of complaints received per week about poor service. The probabilities for numbers of complaints in a week, established by this review, are shown in the table. Number of complaints 0 1 2 3 4 5 Probability 0.15 0.26 0.34 0.06 0.09 0.10 What is the probability of between 2 and 3 (inclusive) complaints received per week? Please specify your answer in decimal terms and round your answer to the nearest hundredth (e.g.,...
A used-car dealer gets complaints about his cars as shown in the table. Number of complaints...
 A used-car dealer gets complaints about his cars as shown in the table. Number of complaints per day 0 1 2 3 4 5 6 Probability 0.02 0.07 0.19 0.26 0.26 0.11 0.09 Find the expected number of complaints per day. The expected number of complaints per day is (Type an integer or a decimal. Do not round your answer.)
And insurance office records the number of claims X receive each day in build a probability...
 And insurance office records the number of claims X receive
each day in build a probability distribution table below using the
data collected find the mean and standard deviation of a
probability distribution
bunding Numbers Calcular OneStop Austin Peay State! + V com/learn/course/Saala356-2cd6-404-9700-47b203f81404/assignment/a51937c3-46f1-4589-b631-603d8b14d117 Calculate Mean and Standard Deviation for a Discrete Probability Distribution Using Technology - Calculator Question An insurance office records the number of claims, X, received each day and built the probability distribution tak using the data collected....
And insurance office records the number of claims X receive
each day in build a probability distribution table below using the
data collected find the mean and standard deviation of a
probability distribution
bunding Numbers Calcular OneStop Austin Peay State! + V com/learn/course/Saala356-2cd6-404-9700-47b203f81404/assignment/a51937c3-46f1-4589-b631-603d8b14d117 Calculate Mean and Standard Deviation for a Discrete Probability Distribution Using Technology - Calculator Question An insurance office records the number of claims, X, received each day and built the probability distribution tak using the data collected....
This Question: 2 pts 5 of 42 (0 complete) 5 0.1 A used-car dealer gets complaints...
 This Question: 2 pts 5 of 42 (0 complete) 5 0.1 A used-car dealer gets complaints about his cars as shown in the table. Number of complaints per day 0 1 2 3 4 6 D Probability 0.01 0.08 0.15 0.23 0.33 0.1 Find the expected number of complaints per day. The expected number of complaints per day is . (Type an integer or a decimal. Do not round your answer.)
A department store manager has monitored the number of complaints received per week about poor service....
A department store manager has monitored the number of complaints received per week about poor service. The probabilities for numbers of complaints in a week, established by this review, are shown in the table. Number of complaints 0 1 2 3 4 5 Probability 0.20 0.29 0.26 0.12 0.05 0.08 What is the probability of between 1 and 3 (inclusive) complaints received per week? Please specify your answer in decimal terms and round your answer to the nearest hundredth (e.g.,...
 A used-car dealer gets complaints about his cars as shown in the table. Number of complaints per day 1 2 3 4 5 6 0.01 0.04 0.13 0.21 0.41 0.14 0.06 Probability Find the expected number of complaints per day The expected number of complaints per day is (Type an integer or a decimal. Do not round your answer.)
A used-car dealer gets complaints about his cars as shown in the table. Number of complaints per day 1 2 3...
A used-car dealer gets complaints about his cars as shown in the table. Number of complaints per day 1 2 3 4 5 6 0.01 0.04 0.13 0.21 0.41 0.14 0.06 Probability Find the expected number of complaints per day The expected number of complaints per day is (Type an integer or a decimal. Do not round your answer.)
A used-car dealer gets complaints about his cars as shown in the table. Number of complaints per day 1 2 3...
 A used-car dealer gets complaints about his cars as shown in the table. Number of complaints per day 0 1 2 3 4 5 6 Probability 0.02 0.07 0.19 0.26 0.26 0.11 0.09 Find the expected number of complaints per day. The expected number of complaints per day is (Type an integer or a decimal. Do not round your answer.)
 And insurance office records the number of claims X receive
each day in build a probability distribution table below using the
data collected find the mean and standard deviation of a
probability distribution
bunding Numbers Calcular OneStop Austin Peay State! + V com/learn/course/Saala356-2cd6-404-9700-47b203f81404/assignment/a51937c3-46f1-4589-b631-603d8b14d117 Calculate Mean and Standard Deviation for a Discrete Probability Distribution Using Technology - Calculator Question An insurance office records the number of claims, X, received each day and built the probability distribution tak using the data collected....
And insurance office records the number of claims X receive
each day in build a probability distribution table below using the
data collected find the mean and standard deviation of a
probability distribution
bunding Numbers Calcular OneStop Austin Peay State! + V com/learn/course/Saala356-2cd6-404-9700-47b203f81404/assignment/a51937c3-46f1-4589-b631-603d8b14d117 Calculate Mean and Standard Deviation for a Discrete Probability Distribution Using Technology - Calculator Question An insurance office records the number of claims, X, received each day and built the probability distribution tak using the data collected....
 This Question: 2 pts 5 of 42 (0 complete) 5 0.1 A used-car dealer gets complaints about his cars as shown in the table. Number of complaints per day 0 1 2 3 4 6 D Probability 0.01 0.08 0.15 0.23 0.33 0.1 Find the expected number of complaints per day. The expected number of complaints per day is . (Type an integer or a decimal. Do not round your answer.)
Most questions answered within 3 hours.
-
Where is the error in this code sequence?
String s1 = "Hello";
String s2 = "ello";...
asked 11 months ago -
Financial data for Joel de Paris, Inc., for last year
follow:
Joel de Paris, Inc.
Balance...
asked 11 months ago -
Consider this reaction:
Al2(SO4)3 (aq)+ BaCl3
(aq) Al2Cl6 (aq)- +
3BaSO4(s) . What is the...
asked 11 months ago -
Suppose that Savneet is considering increasing her
recent random sample from 20 car rentals to 40...
asked 11 months ago -
Trucks arrive at an unloading terminal at an average rate of 120
per hour.
Trucks arrive...
asked 11 months ago -
Why are methanol and ethanol completely soluble in water while
octanol is not very little soluble....
asked 11 months ago -
A facilities manager at a university reads in a research report
that the mean amount of...
asked 11 months ago -
When the CuSO4 is rehydrated by adding water to the anhydrous
compound, is this an endothermic...
asked 11 months ago -
A ray of sunlight is passing from diamond into crown glass; the
angle of incidence is...
asked 11 months ago -
A block of mass 0.249 kg is placed on top of a light, vertical
spring of...
asked 11 months ago -
how do the kidneys compensate in the presences of acidosis
a) trigger hyperventilate
b) reserve acid...
asked 11 months ago -
Question 501 pts
The rental rate of capital to the firm increases. Which of the
following...
asked 11 months ago