


Homework Answers
Que.1
a.
Probability that who differs from expected value is
=1 - (74/118)
= 0.373
b.
Hypothesis:

c.
Test statistic,
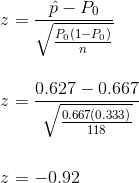
P-value = 2*P(z < -0.92) = 2 * 0.1788 =0.3576
Add Answer to:
It is known that roughly 2/3 of all human beings have a dominant right foot or...
It is known that roughly 2/3 of all human beings have a dominant right foot or...
It is known that roughly 2/3 of all human beings have a dominant right foot or eye. Is there also right-sided dominance in kissing behavior? An article reported that in a random sample of 118 kissing couples, both people in 74 of the couples tended to lean more to the right than to the left. (Use α = 0.05.) (a) If 2/3 of all kissing couples exhibit this right-leaning behavior, what is the probability that the number in a sample...
It is known that roughly 2/3 of all human beings have a dominant right foot or...
 It is known that roughly 2/3 of all human beings have a dominant right foot or eye. Is there also right-sided dominance in kissing behavior? An article reported that in a random sample of 124 kissing couples, both people in 77 of the couples tended to lean more to the right than to the left. (Use α = 0.05.) (a) If 2/3 of all kissing couples exhibit this right-leaning behavior, what is the probability that the number in a sample...
It is known that roughly 2/3 of all human beings have a dominant right foot or...
It is known that roughly 2/3 of all human beings have a dominant right foot or eye. Is there also right-sided dominance in kissing behavior? An article reported that in a random sample of 136 kissing couples, both people in 88 of the couples tended to lean more to the right than to the left. (Use ? = 0.05.) (a) If 2/3 of all kissing couples exhibit this right-leaning behavior, what is the probability that the number in a sample...
It is known that roughly 2/3 of all human beings have a dominant right foot or...
It is known that roughly 2/3 of all human beings have a dominant right foot or eye. Is there also right-sided dominance in kissing behavior? An article reported that in a random sample of 136 kissing couples, both people in 87 of the couples tended to lean more to the right than to the left. (Use α = 0.05.) (a) If 2/3 of all kissing couples exhibit this right-leaning behavior, what is the probability that the number in a sample...
I need the Z and P-value also part B answered. Double-check your work as I don't...
 I need the Z and P-value also part B answered. Double-check your
work as I don't know but I managed to get this wrong a few times.
Thank you!
A plan for an executive travelers' club has been developed by an airline on the premise that 5% of its current customers would qualify for membership. A random sample of 500 customers yielded 39 who would qualify (a) Using this data, test at level 0.01 the null hypothesis that the com...
I need the Z and P-value also part B answered. Double-check your
work as I don't know but I managed to get this wrong a few times.
Thank you!
A plan for an executive travelers' club has been developed by an airline on the premise that 5% of its current customers would qualify for membership. A random sample of 500 customers yielded 39 who would qualify (a) Using this data, test at level 0.01 the null hypothesis that the com...
I need help with just the parts I got wrong, thanks! at9 8 E.046 that roughly...
 I
need help with just the parts I got wrong, thanks!
at9 8 E.046 that roughly 2/3 of all human beings have a dominant right foot or eye. Is there also right-sided dominance in kissing It is behavior? An article reported that in a random sample of 115 kissing couples, both people in 71 of the couples tended to lean more t the right than to the left. (Use α = 0.05.) (a) If 2/3 of all kissing couples exhibit...
I
need help with just the parts I got wrong, thanks!
at9 8 E.046 that roughly 2/3 of all human beings have a dominant right foot or eye. Is there also right-sided dominance in kissing It is behavior? An article reported that in a random sample of 115 kissing couples, both people in 71 of the couples tended to lean more t the right than to the left. (Use α = 0.05.) (a) If 2/3 of all kissing couples exhibit...
A plan for an executive travelers' club has been developed by an airline on the premise...
 A plan for an executive travelers' club has been developed by an airline on the premise that 5% of its current customers would qualify for membership. A random sample of 500 customers yielded 40 who would qualify. (a) Using this data, test at level 0.01 the null hypothesis that the company's premise is correct against the alternative that it is not correct. State the appropriate null and alternative hypotheses. Ho: P = 0.05 Ha: p = 0.05 Ho: P =...
Aplan for an en utive travers' has been developed by an anne on the 500 customers...
 Aplan for an en utive travers' has been developed by an anne on the 500 customers yieided 38 who would qualithy mise that 5% of its arrent oustones would quary for membryp Agdom uretof (a) Using this data, test at level o.03 the ull hypothesis that the company's premise is correct apainst the alternative that t is not correct State the appropriate null and aiternative hypotheses , p 0.0s Hp 0.05 He' ρ < 0.05 Moi P 0.05 Hp-005 Pvalue...
The data to the right show the average retirement ages for a random sample of workers...
 The data to the right show the average retirement ages for a random sample of workers in Country A and a random sample of workers in Country B. Complete parts a and b Country A 65.2 years 30 Country B 66.8 years 30 Sample mean Sample size Population standard deviation 4.5 years 5.1 years a. Perform a hypothesis test using α= 0.05 to determine if the average retirement age in Country B is higher than it is in Country A....
2. The article "Uncertainty Estimation in Railway Track Life-Cycle Cost"+ presented the following data on time...
 2. The article "Uncertainty Estimation in Railway Track Life-Cycle Cost"+ presented the following data on time to repair (min) a rail break in the high rail on a curved track of a certain railway line. 159 120 480 149 270 547 340 43 228 202 240 218 A normal probability plot of the data shows a reasonably linear pattern, so it is plausible that the population distribution of repair time is at least approximately normal. The sample mean and standard...
 It is known that roughly 2/3 of all human beings have a dominant right foot or eye. Is there also right-sided dominance in kissing behavior? An article reported that in a random sample of 124 kissing couples, both people in 77 of the couples tended to lean more to the right than to the left. (Use α = 0.05.) (a) If 2/3 of all kissing couples exhibit this right-leaning behavior, what is the probability that the number in a sample...
 I need the Z and P-value also part B answered. Double-check your
work as I don't know but I managed to get this wrong a few times.
Thank you!
A plan for an executive travelers' club has been developed by an airline on the premise that 5% of its current customers would qualify for membership. A random sample of 500 customers yielded 39 who would qualify (a) Using this data, test at level 0.01 the null hypothesis that the com...
I need the Z and P-value also part B answered. Double-check your
work as I don't know but I managed to get this wrong a few times.
Thank you!
A plan for an executive travelers' club has been developed by an airline on the premise that 5% of its current customers would qualify for membership. A random sample of 500 customers yielded 39 who would qualify (a) Using this data, test at level 0.01 the null hypothesis that the com...
 I
need help with just the parts I got wrong, thanks!
at9 8 E.046 that roughly 2/3 of all human beings have a dominant right foot or eye. Is there also right-sided dominance in kissing It is behavior? An article reported that in a random sample of 115 kissing couples, both people in 71 of the couples tended to lean more t the right than to the left. (Use α = 0.05.) (a) If 2/3 of all kissing couples exhibit...
I
need help with just the parts I got wrong, thanks!
at9 8 E.046 that roughly 2/3 of all human beings have a dominant right foot or eye. Is there also right-sided dominance in kissing It is behavior? An article reported that in a random sample of 115 kissing couples, both people in 71 of the couples tended to lean more t the right than to the left. (Use α = 0.05.) (a) If 2/3 of all kissing couples exhibit...
 A plan for an executive travelers' club has been developed by an airline on the premise that 5% of its current customers would qualify for membership. A random sample of 500 customers yielded 40 who would qualify. (a) Using this data, test at level 0.01 the null hypothesis that the company's premise is correct against the alternative that it is not correct. State the appropriate null and alternative hypotheses. Ho: P = 0.05 Ha: p = 0.05 Ho: P =...
 Aplan for an en utive travers' has been developed by an anne on the 500 customers yieided 38 who would qualithy mise that 5% of its arrent oustones would quary for membryp Agdom uretof (a) Using this data, test at level o.03 the ull hypothesis that the company's premise is correct apainst the alternative that t is not correct State the appropriate null and aiternative hypotheses , p 0.0s Hp 0.05 He' ρ < 0.05 Moi P 0.05 Hp-005 Pvalue...
 The data to the right show the average retirement ages for a random sample of workers in Country A and a random sample of workers in Country B. Complete parts a and b Country A 65.2 years 30 Country B 66.8 years 30 Sample mean Sample size Population standard deviation 4.5 years 5.1 years a. Perform a hypothesis test using α= 0.05 to determine if the average retirement age in Country B is higher than it is in Country A....
 2. The article "Uncertainty Estimation in Railway Track Life-Cycle Cost"+ presented the following data on time to repair (min) a rail break in the high rail on a curved track of a certain railway line. 159 120 480 149 270 547 340 43 228 202 240 218 A normal probability plot of the data shows a reasonably linear pattern, so it is plausible that the population distribution of repair time is at least approximately normal. The sample mean and standard...
Most questions answered within 3 hours.
-
Where is the error in this code sequence?
String s1 = "Hello";
String s2 = "ello";...
asked 11 months ago -
Financial data for Joel de Paris, Inc., for last year
follow:
Joel de Paris, Inc.
Balance...
asked 11 months ago -
Consider this reaction:
Al2(SO4)3 (aq)+ BaCl3
(aq) Al2Cl6 (aq)- +
3BaSO4(s) . What is the...
asked 11 months ago -
Suppose that Savneet is considering increasing her
recent random sample from 20 car rentals to 40...
asked 11 months ago -
Trucks arrive at an unloading terminal at an average rate of 120
per hour.
Trucks arrive...
asked 11 months ago -
Why are methanol and ethanol completely soluble in water while
octanol is not very little soluble....
asked 11 months ago -
A facilities manager at a university reads in a research report
that the mean amount of...
asked 11 months ago -
When the CuSO4 is rehydrated by adding water to the anhydrous
compound, is this an endothermic...
asked 11 months ago -
A ray of sunlight is passing from diamond into crown glass; the
angle of incidence is...
asked 11 months ago -
A block of mass 0.249 kg is placed on top of a light, vertical
spring of...
asked 11 months ago -
how do the kidneys compensate in the presences of acidosis
a) trigger hyperventilate
b) reserve acid...
asked 11 months ago -
Question 501 pts
The rental rate of capital to the firm increases. Which of the
following...
asked 11 months ago