
Homework Answers
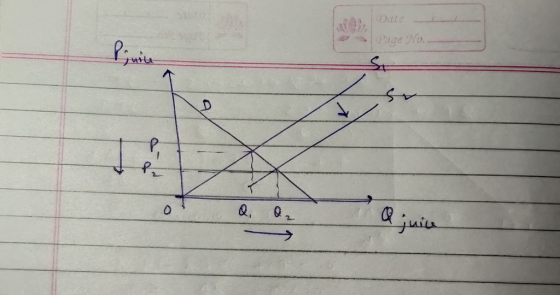
So scientist know how to increase output of oranges. Thus supply of oranges increases which is the main ingredient in the orange juice market. Thus supply of oranges increases and it leads to supply of orange juice to increase as well. The supply curve shifts rightwards from S1 to S2. The price falls down from P1 to P2. And the quantity increases from Q1 to Q2.
Add Answer to:
1. Scientists discover how to increase the output of oranges per tree. Show what happens in...
1. Suppose Andy sells oranges in a perfectly competitive market. The following table represents his output...
 1. Suppose Andy sells oranges in a perfectly competitive market. The following table represents his output and costs: Output Total Fixed Variable ATC AFC AVC MC per day Cost Cost Cost $10.00 $20.50 $24.50 $28.00 $34.00 $43.00 $55.50 $72.00 $93.00 $119.00 a) Fill in the missing columns b) Suppose the equilibrium price for oranges in the market is $12.50. How many oranges should Andy sell if he wants to maximize profits? What price will he charge for a unit of...
A hurricane destroys the orange crop in Florida. What happens to the market for oranges? Select...
 A hurricane destroys the orange crop in Florida. What happens to the market for oranges? Select one: 0 a. supply increases and price decreases O b. supply decreases and price decreases O c. supply increases and price increases O d. supply decreases and price increases
IS. Which of the following best describes what happens when the price of oranges increases? a)...
 IS. Which of the following best describes what happens when the price of oranges increases? a) There is a shift to the right in the demand curve for oranges b) There is a shift to the left of the demand curve for oranges c) There is a shift along the demand curve for oranges d) There is a no change in the demand curve for oranges 16. Which of the following best describes what happens when consumer income increases? a)...
The cross-price elasticity between Gillette razors and a related good is -34. What happens to the demand for the r...
 The cross-price elasticity between Gillette razors and a related good is -34. What happens to the demand for the related good if the price of Gillette razors fals by 10 percent The quantity demanded of the related good rises by 3.4 percent. The quantity demanded of the related good falls by 34 percent. The quantity demanded of the related good rises by 34 percent. The quantity demanded of the related good falls by 3.4 percent. Suppose the cross-price elasticity of...
Use the graphs provided to predict what will happen to the equilibrium price and quantity of...
 Use the graphs provided to predict what will happen to the equilibrium price and quantity of oranges if the following events take place Instruction: Depict how this event will affect the market of oranges by dragging the appropriate curve in the graph a. A study finds that a daily glass of orange juice reduces the risk of heart disease. Market for oranges P* Q* Quantity (oranges/week) reset Equilibrium price will increase and equilibrium quantity will decrease. Equilibrium price will decrease...
(1 point) In the market for oranges, there are two demanders and two suppliers. Here are...
 (1 point) In the market for oranges, there are two demanders and two suppliers. Here are their marginal value and marginal cost curves, Demanders II Suppliers Pinky | The Brain Orange Land Orange World QMV i MVQ MCQ MC 1 $15 1 $1111 $ 2 1 2 $7 2 591 2 $ 3 2 3 $ 6 3 $8 113 $4 3 4 $5 14 $ 7 4 $6 14 5 $ 45 $ 65 75 On the market demand...
Figure AS-AD.1 AD2 AD1 AD3 Real Domestic Output, GDP 13) In Figure AS.AD.1, what combination would...
 Figure AS-AD.1 AD2 AD1 AD3 Real Domestic Output, GDP 13) In Figure AS.AD.1, what combination would most likely cause a shift from ADI to AD2? A) A decrease in taxes and an increase in government purchases B) An increase in taxes and an increase in government purchases 14) Other things being equal, the effects of an increase in the price of orange juice would best be represented by a(n): A) upward movement along the demand curve for orange juice. B)...
Using profit maximization, what happens to output as costs rise? The complete answer will show a...
Using profit maximization, what happens to output as costs rise? The complete answer will show a profit maximization graph with an increase in costs.
1) Suppose that the demand curve for oranges is given by the equation 0200P+ 1000 with...
 1) Suppose that the demand curve for oranges is given by the equation 0200P+ 1000 with quantity (Q) measured in oranges per day and price (P) given in dollars per orange. The supply curve is given by 0 300P Suppose that a $1.00 per unit sales tax is placed on oranges. What are the equations for the new supply and demand curves? What is the new equilibrium price and quantity of oranges? What do buyers pay per unit? What do...
Consider the market for oranges in the US. Suppose we begin with an equilibrium in this...
 Consider the market for oranges in the US. Suppose we begin with an equilibrium in this market, where quantity produced is equal to quantity demanded, which is equal to 5 million tons of oranges. Further suppose the price of a pound of oranges is $2.50. a. Illustrate this equilibrium by using supply and demand curves. Don't forget to label the axes, show the equilibrium quantity and the equilibrium price. (5 pts) b. Now suppose a tropical storm hits Florida destroying...
 1. Suppose Andy sells oranges in a perfectly competitive market. The following table represents his output and costs: Output Total Fixed Variable ATC AFC AVC MC per day Cost Cost Cost $10.00 $20.50 $24.50 $28.00 $34.00 $43.00 $55.50 $72.00 $93.00 $119.00 a) Fill in the missing columns b) Suppose the equilibrium price for oranges in the market is $12.50. How many oranges should Andy sell if he wants to maximize profits? What price will he charge for a unit of...
 A hurricane destroys the orange crop in Florida. What happens to the market for oranges? Select one: 0 a. supply increases and price decreases O b. supply decreases and price decreases O c. supply increases and price increases O d. supply decreases and price increases
 IS. Which of the following best describes what happens when the price of oranges increases? a) There is a shift to the right in the demand curve for oranges b) There is a shift to the left of the demand curve for oranges c) There is a shift along the demand curve for oranges d) There is a no change in the demand curve for oranges 16. Which of the following best describes what happens when consumer income increases? a)...
 The cross-price elasticity between Gillette razors and a related good is -34. What happens to the demand for the related good if the price of Gillette razors fals by 10 percent The quantity demanded of the related good rises by 3.4 percent. The quantity demanded of the related good falls by 34 percent. The quantity demanded of the related good rises by 34 percent. The quantity demanded of the related good falls by 3.4 percent. Suppose the cross-price elasticity of...
 Use the graphs provided to predict what will happen to the equilibrium price and quantity of oranges if the following events take place Instruction: Depict how this event will affect the market of oranges by dragging the appropriate curve in the graph a. A study finds that a daily glass of orange juice reduces the risk of heart disease. Market for oranges P* Q* Quantity (oranges/week) reset Equilibrium price will increase and equilibrium quantity will decrease. Equilibrium price will decrease...
 (1 point) In the market for oranges, there are two demanders and two suppliers. Here are their marginal value and marginal cost curves, Demanders II Suppliers Pinky | The Brain Orange Land Orange World QMV i MVQ MCQ MC 1 $15 1 $1111 $ 2 1 2 $7 2 591 2 $ 3 2 3 $ 6 3 $8 113 $4 3 4 $5 14 $ 7 4 $6 14 5 $ 45 $ 65 75 On the market demand...
 Figure AS-AD.1 AD2 AD1 AD3 Real Domestic Output, GDP 13) In Figure AS.AD.1, what combination would most likely cause a shift from ADI to AD2? A) A decrease in taxes and an increase in government purchases B) An increase in taxes and an increase in government purchases 14) Other things being equal, the effects of an increase in the price of orange juice would best be represented by a(n): A) upward movement along the demand curve for orange juice. B)...
 1) Suppose that the demand curve for oranges is given by the equation 0200P+ 1000 with quantity (Q) measured in oranges per day and price (P) given in dollars per orange. The supply curve is given by 0 300P Suppose that a $1.00 per unit sales tax is placed on oranges. What are the equations for the new supply and demand curves? What is the new equilibrium price and quantity of oranges? What do buyers pay per unit? What do...
 Consider the market for oranges in the US. Suppose we begin with an equilibrium in this market, where quantity produced is equal to quantity demanded, which is equal to 5 million tons of oranges. Further suppose the price of a pound of oranges is $2.50. a. Illustrate this equilibrium by using supply and demand curves. Don't forget to label the axes, show the equilibrium quantity and the equilibrium price. (5 pts) b. Now suppose a tropical storm hits Florida destroying...
Most questions answered within 3 hours.
-
Where is the error in this code sequence?
String s1 = "Hello";
String s2 = "ello";...
asked 10 months ago -
Financial data for Joel de Paris, Inc., for last year
follow:
Joel de Paris, Inc.
Balance...
asked 10 months ago -
Consider this reaction:
Al2(SO4)3 (aq)+ BaCl3
(aq) Al2Cl6 (aq)- +
3BaSO4(s) . What is the...
asked 10 months ago -
Suppose that Savneet is considering increasing her
recent random sample from 20 car rentals to 40...
asked 10 months ago -
Trucks arrive at an unloading terminal at an average rate of 120
per hour.
Trucks arrive...
asked 10 months ago -
Why are methanol and ethanol completely soluble in water while
octanol is not very little soluble....
asked 10 months ago -
A facilities manager at a university reads in a research report
that the mean amount of...
asked 10 months ago -
When the CuSO4 is rehydrated by adding water to the anhydrous
compound, is this an endothermic...
asked 10 months ago -
A ray of sunlight is passing from diamond into crown glass; the
angle of incidence is...
asked 10 months ago -
A block of mass 0.249 kg is placed on top of a light, vertical
spring of...
asked 10 months ago -
how do the kidneys compensate in the presences of acidosis
a) trigger hyperventilate
b) reserve acid...
asked 10 months ago -
Question 501 pts
The rental rate of capital to the firm increases. Which of the
following...
asked 10 months ago