
Homework Answers
welcome
the given graph f(x) has shifted 1 unit to the right
so it becomes f(x - 1)
also graph has shifted 1 unit upward
so g(x) = f(x-1) + 1
thus 'A' is the right option.
The graph on the left is the graph of y = f(x) while the graph on...
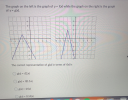 The graph on the left is the graph of y = f(x) while the graph on the right is the graph of y = g(x). * ** D .... in. The correct representation of g(x) in terms of fx) is Og(x) = K2x) g(x) = f(0.5x) g(x) = 2x) O g(x) = 0.5AX)
For problems 8-12, use the graph of y=f(x) and the table for g(x) and g'(x) to...
 For problems 8-12, use the graph of y=f(x) and the table for g(x) and g'(x) to compute the indicated derivatives. Write your final answer and only your final answer) in the space provided. Answers should be exact and fractions should be used where appropriate (do not use numbers in decimal form). 1 -4 -2 g(x) 2 5/2 3 14/5 &'(x) 7/5 1/2 1/4 -1/4 0 2 قيا 2 - 1 -2 - 1/2 4 0 5 6 8 1 6...
please step by step with explanation help with #1,3,10,11,20,23,29,32a 1. Suppose the graph of f is...
 please step by step with explanation help with
#1,3,10,11,20,23,29,32a
1. Suppose the graph of f is given. Write equations for the graphs that are obtained from the graph of f as follows. a. Shift 3 units upward. Answer + b. Shift 3 units downward. Answer c. Shift 3 units to the right. Answer + d. Shift 3 units to the left. Answer e. Reflect about the z-axis. Answer Answer d. Shift 3 units to the left. Answer + e. Reflect...
please step by step with explanation help with
#1,3,10,11,20,23,29,32a
1. Suppose the graph of f is given. Write equations for the graphs that are obtained from the graph of f as follows. a. Shift 3 units upward. Answer + b. Shift 3 units downward. Answer c. Shift 3 units to the right. Answer + d. Shift 3 units to the left. Answer e. Reflect about the z-axis. Answer Answer d. Shift 3 units to the left. Answer + e. Reflect...
The graph of y(x) is shown to the right. Identily the intervals on which f'(x) <0....
 The graph of y(x) is shown to the right. Identily the intervals on which f'(x) <0. Which of the following shows every interval on which f(x) <0? Choose the correct answer below. O A. (b,d), (g) C. (a,b). (c.e). (g) O B. (a,b). (ce) O D. (a,b), (c,d), (g) Click to select your answer
(1 point) Shown below is the graph of y- f'(x), NOT the graph of y-f(x). (Click on the picture fo...
 (1 point) Shown below is the graph of y- f'(x), NOT the graph of y-f(x). (Click on the picture for a better view.) From the information in this graph we can conclude that a good approximation to f(-5.04)- f(-5) is 0.08 Shown below is the graph of a different function, y - g(x). (Click on the picture for a better view.) Indicate the labeled point at which g(x) changes sign: a g'(x) changes sign: d g"(x) changes sign: c
(1...
(1 point) Shown below is the graph of y- f'(x), NOT the graph of y-f(x). (Click on the picture for a better view.) From the information in this graph we can conclude that a good approximation to f(-5.04)- f(-5) is 0.08 Shown below is the graph of a different function, y - g(x). (Click on the picture for a better view.) Indicate the labeled point at which g(x) changes sign: a g'(x) changes sign: d g"(x) changes sign: c
(1...
1. DETAILS HARMATHAPBR1 9.1.003. A graph of y = f(x) is shown and a c-value is...
 1. DETAILS HARMATHAPBR1 9.1.003. A graph of y = f(x) is shown and a c-value is given. Use the graph to find the following, whenever they exist. (If an answer does not exist, enter DNE.) C = -8 y = f(x) -12-8 -87 (a) lim f(x) X-C -6 f(c) (b) -6
(a) The graph ofy =f(x) is shown. Graph y = 2f (x). (b) The graph of...
 (a) The graph ofy =f(x) is shown. Graph y = 2f (x). (b) The graph of y = g (x) is shown. Graph y =g (2x) Part (a) Part (b) ? ? X
(a) The graph ofy =f(x) is shown. Graph y = 2f (x). (b) The graph of y = g (x) is shown. Graph y =g (2x) Part (a) Part (b) ? ? X
(a) The graph ofy =f(x) is shown. Graph y = 2f (x). (b) The graph of y = g (x) is shown. Graph y =g (2x) Part (a) Part (b) ? ? X
6) The acceleration of an object is given by the graph shown below on the left....
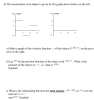 6) The acceleration of an object is given by the graph shown below on the left. a(t) inmsec (t) in msec 3 a) Make a graph of the velocity function v, of this object if-, on the giver axis on the right. b) Let be the position function of the object with 0-0. What is the position of the object at-3, i.e. what is 3)? Explain! c) What is the relationship between the total change, )-v(0), in over the interval...
11. Write the equation for the graph of g(x) as a transformation of the equation for...
 11. Write the equation for the graph of g(x) as a transformation of the equation for the graph of f(x). 8 g(x) 6 4 f(x) 2 4 -20 2 2 12. Consider the graph of y = f(x). Sketch the graph of each transformation. y y = f(x) ob 6 4 21 a) y= {fl-(x + 2)) b) y - 2 = -f(2(x - 3)) c) y - 1 = 3f(2x + 4)
5. Given the graph of y = f(x), shown below, answer the following, by inspection. (0.5...
 5. Given the graph of y = f(x), shown below, answer the following, by inspection. (0.5 mark each, 4.5 marks total). 2 2 -3 -6 -7 a) f(0) = b) f(2)= c) lim f(x) = d) lim f(x) = e) lim, f(x) = d) lim f(x) = g) lim f(x) = h) lim. f(x) = i) lim f(x) = x 2 3-2-
 The graph on the left is the graph of y = f(x) while the graph on the right is the graph of y = g(x). * ** D .... in. The correct representation of g(x) in terms of fx) is Og(x) = K2x) g(x) = f(0.5x) g(x) = 2x) O g(x) = 0.5AX)
 For problems 8-12, use the graph of y=f(x) and the table for g(x) and g'(x) to compute the indicated derivatives. Write your final answer and only your final answer) in the space provided. Answers should be exact and fractions should be used where appropriate (do not use numbers in decimal form). 1 -4 -2 g(x) 2 5/2 3 14/5 &'(x) 7/5 1/2 1/4 -1/4 0 2 قيا 2 - 1 -2 - 1/2 4 0 5 6 8 1 6...
 please step by step with explanation help with
#1,3,10,11,20,23,29,32a
1. Suppose the graph of f is given. Write equations for the graphs that are obtained from the graph of f as follows. a. Shift 3 units upward. Answer + b. Shift 3 units downward. Answer c. Shift 3 units to the right. Answer + d. Shift 3 units to the left. Answer e. Reflect about the z-axis. Answer Answer d. Shift 3 units to the left. Answer + e. Reflect...
please step by step with explanation help with
#1,3,10,11,20,23,29,32a
1. Suppose the graph of f is given. Write equations for the graphs that are obtained from the graph of f as follows. a. Shift 3 units upward. Answer + b. Shift 3 units downward. Answer c. Shift 3 units to the right. Answer + d. Shift 3 units to the left. Answer e. Reflect about the z-axis. Answer Answer d. Shift 3 units to the left. Answer + e. Reflect...
 The graph of y(x) is shown to the right. Identily the intervals on which f'(x) <0. Which of the following shows every interval on which f(x) <0? Choose the correct answer below. O A. (b,d), (g) C. (a,b). (c.e). (g) O B. (a,b). (ce) O D. (a,b), (c,d), (g) Click to select your answer
 (1 point) Shown below is the graph of y- f'(x), NOT the graph of y-f(x). (Click on the picture for a better view.) From the information in this graph we can conclude that a good approximation to f(-5.04)- f(-5) is 0.08 Shown below is the graph of a different function, y - g(x). (Click on the picture for a better view.) Indicate the labeled point at which g(x) changes sign: a g'(x) changes sign: d g"(x) changes sign: c
(1...
(1 point) Shown below is the graph of y- f'(x), NOT the graph of y-f(x). (Click on the picture for a better view.) From the information in this graph we can conclude that a good approximation to f(-5.04)- f(-5) is 0.08 Shown below is the graph of a different function, y - g(x). (Click on the picture for a better view.) Indicate the labeled point at which g(x) changes sign: a g'(x) changes sign: d g"(x) changes sign: c
(1...
 1. DETAILS HARMATHAPBR1 9.1.003. A graph of y = f(x) is shown and a c-value is given. Use the graph to find the following, whenever they exist. (If an answer does not exist, enter DNE.) C = -8 y = f(x) -12-8 -87 (a) lim f(x) X-C -6 f(c) (b) -6
 (a) The graph ofy =f(x) is shown. Graph y = 2f (x). (b) The graph of y = g (x) is shown. Graph y =g (2x) Part (a) Part (b) ? ? X
(a) The graph ofy =f(x) is shown. Graph y = 2f (x). (b) The graph of y = g (x) is shown. Graph y =g (2x) Part (a) Part (b) ? ? X
(a) The graph ofy =f(x) is shown. Graph y = 2f (x). (b) The graph of y = g (x) is shown. Graph y =g (2x) Part (a) Part (b) ? ? X
 6) The acceleration of an object is given by the graph shown below on the left. a(t) inmsec (t) in msec 3 a) Make a graph of the velocity function v, of this object if-, on the giver axis on the right. b) Let be the position function of the object with 0-0. What is the position of the object at-3, i.e. what is 3)? Explain! c) What is the relationship between the total change, )-v(0), in over the interval...
 11. Write the equation for the graph of g(x) as a transformation of the equation for the graph of f(x). 8 g(x) 6 4 f(x) 2 4 -20 2 2 12. Consider the graph of y = f(x). Sketch the graph of each transformation. y y = f(x) ob 6 4 21 a) y= {fl-(x + 2)) b) y - 2 = -f(2(x - 3)) c) y - 1 = 3f(2x + 4)
 5. Given the graph of y = f(x), shown below, answer the following, by inspection. (0.5 mark each, 4.5 marks total). 2 2 -3 -6 -7 a) f(0) = b) f(2)= c) lim f(x) = d) lim f(x) = e) lim, f(x) = d) lim f(x) = g) lim f(x) = h) lim. f(x) = i) lim f(x) = x 2 3-2-
Most questions answered within 3 hours.
-
Where is the error in this code sequence?
String s1 = "Hello";
String s2 = "ello";...
asked 11 months ago -
Financial data for Joel de Paris, Inc., for last year
follow:
Joel de Paris, Inc.
Balance...
asked 11 months ago -
Consider this reaction:
Al2(SO4)3 (aq)+ BaCl3
(aq) Al2Cl6 (aq)- +
3BaSO4(s) . What is the...
asked 11 months ago -
Suppose that Savneet is considering increasing her
recent random sample from 20 car rentals to 40...
asked 11 months ago -
Trucks arrive at an unloading terminal at an average rate of 120
per hour.
Trucks arrive...
asked 11 months ago -
Why are methanol and ethanol completely soluble in water while
octanol is not very little soluble....
asked 11 months ago -
A facilities manager at a university reads in a research report
that the mean amount of...
asked 11 months ago -
When the CuSO4 is rehydrated by adding water to the anhydrous
compound, is this an endothermic...
asked 11 months ago -
A ray of sunlight is passing from diamond into crown glass; the
angle of incidence is...
asked 11 months ago -
A block of mass 0.249 kg is placed on top of a light, vertical
spring of...
asked 11 months ago -
how do the kidneys compensate in the presences of acidosis
a) trigger hyperventilate
b) reserve acid...
asked 11 months ago -
Question 501 pts
The rental rate of capital to the firm increases. Which of the
following...
asked 11 months ago