
Homework Answers
Hi,
Consider,
Carbohydrates (gram): Independent variable
Amount of energy (kilocalories): Dependent variable
| Carbohydrates (gm) X | Energy (kilocalories) Y | X2 | Y2 | XY | |
| 9.5 | 21 | 90.25 | 441 | 199.5 | |
| 4 | 37 | 16 | 1369 | 148 | |
| 1 | 22 | 1 | 484 | 22 | |
| 9 | 18 | 81 | 324 | 162 | |
| 9 | 25 | 81 | 625 | 225 | |
| 3 | 28 | 9 | 784 | 84 | |
| Σ | 35.5 | 151 | 278.25 | 4027 | 840.5 |


a.
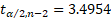
![η(Σχy) - (Σκ) Σy) Correlation Coefficient = r = [η Σχ2 - (Σκ)2][nΣy2 – (Σy)2] = -0.425 (rounded to 3 decimal places)](http://img.homeworklib.com/questions/4ca927c0-8603-11ec-9155-67bfed6a4497.png?x-oss-process=image/resize,w_560)
The correlation coefficient between the amount of carbohydrates and energy produced is r = -0.425.
b.


So, the linear correlation does not exist.
c.
Equation of line best fit to the data is obtained by using the method of least-square.


d.

The estimated amount of energy provided in a sports drink with 9 gms of carbohydrates is 22.775 kilocalories.
Please upvote.
Add Answer to:
The following table shows the energy provided (in kilocalories) and the amount of carbohydrates (in grams)...
Suppose a teacher recorded the attendance of her students in a recent statistics class because she...
 Suppose a teacher recorded the attendance of her students in a
recent statistics class because she wanted to investigate the
linear relationship between the number of classes they missed and
their final grades. The accompanying table shows these data for a
random sample of nine students
Classes Missed Final Grade
4 73
6 81
1 92
4 72
0 94
2 86
0 89
5 87
2 96
Suppose a teacher recorded the attendance of her students in a recent...
Suppose a teacher recorded the attendance of her students in a
recent statistics class because she wanted to investigate the
linear relationship between the number of classes they missed and
their final grades. The accompanying table shows these data for a
random sample of nine students
Classes Missed Final Grade
4 73
6 81
1 92
4 72
0 94
2 86
0 89
5 87
2 96
Suppose a teacher recorded the attendance of her students in a recent...
The data in the table to the right represent the calories and sugar (in grams) in...
 The data in the table to the right represent the calories and
sugar (in grams) in one serving of seven different types of
breakfast cereals.
a. Compute and interpret the coefficient of correlation, r.
b. At the 0.05 level of significance, is there a significant
linear relationship between calories and sugar?
Product
Calories
Sugar
Cereal 1
76
7
Cereal 2
95
2
Cereal 3
99
4
Cereal 4
106
3
Cereal 5
131
5
Cereal 6
189
10
Cereal 7...
The data in the table to the right represent the calories and
sugar (in grams) in one serving of seven different types of
breakfast cereals.
a. Compute and interpret the coefficient of correlation, r.
b. At the 0.05 level of significance, is there a significant
linear relationship between calories and sugar?
Product
Calories
Sugar
Cereal 1
76
7
Cereal 2
95
2
Cereal 3
99
4
Cereal 4
106
3
Cereal 5
131
5
Cereal 6
189
10
Cereal 7...
5 7 8 10 11 12 Suppose a teacher recorded the attendance of her students in...
 5 7 8 10 11 12 Suppose a teacher recorded the attendance of her students in a recent statistics class because she wanted to investigate the linear relationship between the number of classes they missed and their final grades. The accompanying table shows these data for a random sample of nine students. Complete parts a through c. Click the icon to view the table showing missed classes and final grade. a. Calculate the correlation coefficient for this sample. The correlation...
Suppose a teacher recorded the attendance of her students in a recent statistics class because she...
 Suppose a teacher recorded the attendance of her students in a recent statistics class because she wanted to investigate the linear relationship between the number of classes they missed and their final grades. The accompanying table shows these data for a random sample of nine students. Complete parts a through c. Click the icon to view the table showing missed classes and final grade. a. Calculate the correlation coefficient for this sample. The correlation coefficient is I. (Type an integer...
The data in the table to the right represent the calories and sugar (in grams) in...
The data in the table to the right represent the calories and sugar (in grams) in one serving of seven different types of breakfast cereals. a. Compute and interpret the coefficient of correlation, r. b. At the 0.05 level of significance, is there a significant linear relationship between calories and sugar? Product Calories Sugar Cereal 1 8585 66 Cereal 2 9797 22 Cereal 3 102102 55 Cereal 4 108108 33 Cereal 5 135135 33 Cereal 6 186186 1212 Cereal 7...
Click here to view the data set. Click here to view the critical values table. i...
 Click here to view the data set. Click here to view the critical values table. i Data set o LLLL 10 10 x y 2 4 4 8 6 10 6 13 7 19 (b) By hand, compute the correlation coefficient. The correlation coefficient is r= (Round to three decimal places as needed.) Print Done (c) Determine whether there is a linear relation between x and y. Because the correlation coefficient is and the absolute value of the correlation coefficient,...
The following data represent the calories and sugar, in grams, of various breakfast cereals. Product A...
 The following data represent the calories and sugar, in grams, of various breakfast cereals. Product A B с D E F G Calories 260 380 390 410 460 540 590 Sugar 8.7 5.1 21.5 21.4 16.5 22.3 24.2 Use the data above to complete parts (a) through (d). a. Compute the covariance. 742.000 (Round to three decimal places as needed.) b. Compute the coefficient of correlation. r= 0.690 (Round to three decimal places as needed.) c. Which do you think...
Use the given confidence level and sample data to find (a) the margin of error and...
 Use the given confidence level and sample data to find (a) the margin of error and (b) the confidence interval for the population mean u. Assume that the population has a normal distribution. Weight lost on a diet: 90% confidence; n 20, x= 7.0 kg, s 9.2 kg. Click the icon to view a table of critical t-values. kg (Round to one decimal place as needed.) (a) E (b) What is the confidence interval for the population mean u? kg<u...
The best predicted number of Nobel Laureates when the number of internet users per 100 is...
 The best predicted number of Nobel
Laureates when the number of internet users per 100 is 78.4 is
....... round to one decimal place as needed
The best predicted gross for a movie with a $10 million budget
is ...........million. (Round to one decimal place as
needed.)
Find the regression equation, letting the first variable be the predictor (x) variable. Find the best predicted Nobel Laureate rate for a country that has 78.4 Internet users per 100 people. How does...
The best predicted number of Nobel
Laureates when the number of internet users per 100 is 78.4 is
....... round to one decimal place as needed
The best predicted gross for a movie with a $10 million budget
is ...........million. (Round to one decimal place as
needed.)
Find the regression equation, letting the first variable be the predictor (x) variable. Find the best predicted Nobel Laureate rate for a country that has 78.4 Internet users per 100 people. How does...
The amounts of a chemical compound y that dissolved in 100 grams of water at various temperatures x were recorded. Use...
 The amounts of a chemical compound y that dissolved in 100 grams of water at various temperatures x were recorded. Use the given data to complete parts (a) through (c) below. EEB Click the icon to view the recorded data. (a) Find the equation of the regression line. (Round the constant to two decimal places as needed. Round the coefficient to three decimal places as needed.) (b) Graph the line on a scatter diagram. Choose the correct graph below. O...
 Suppose a teacher recorded the attendance of her students in a
recent statistics class because she wanted to investigate the
linear relationship between the number of classes they missed and
their final grades. The accompanying table shows these data for a
random sample of nine students
Classes Missed Final Grade
4 73
6 81
1 92
4 72
0 94
2 86
0 89
5 87
2 96
Suppose a teacher recorded the attendance of her students in a recent...
Suppose a teacher recorded the attendance of her students in a
recent statistics class because she wanted to investigate the
linear relationship between the number of classes they missed and
their final grades. The accompanying table shows these data for a
random sample of nine students
Classes Missed Final Grade
4 73
6 81
1 92
4 72
0 94
2 86
0 89
5 87
2 96
Suppose a teacher recorded the attendance of her students in a recent...
 The data in the table to the right represent the calories and
sugar (in grams) in one serving of seven different types of
breakfast cereals.
a. Compute and interpret the coefficient of correlation, r.
b. At the 0.05 level of significance, is there a significant
linear relationship between calories and sugar?
Product
Calories
Sugar
Cereal 1
76
7
Cereal 2
95
2
Cereal 3
99
4
Cereal 4
106
3
Cereal 5
131
5
Cereal 6
189
10
Cereal 7...
The data in the table to the right represent the calories and
sugar (in grams) in one serving of seven different types of
breakfast cereals.
a. Compute and interpret the coefficient of correlation, r.
b. At the 0.05 level of significance, is there a significant
linear relationship between calories and sugar?
Product
Calories
Sugar
Cereal 1
76
7
Cereal 2
95
2
Cereal 3
99
4
Cereal 4
106
3
Cereal 5
131
5
Cereal 6
189
10
Cereal 7...
 5 7 8 10 11 12 Suppose a teacher recorded the attendance of her students in a recent statistics class because she wanted to investigate the linear relationship between the number of classes they missed and their final grades. The accompanying table shows these data for a random sample of nine students. Complete parts a through c. Click the icon to view the table showing missed classes and final grade. a. Calculate the correlation coefficient for this sample. The correlation...
 Suppose a teacher recorded the attendance of her students in a recent statistics class because she wanted to investigate the linear relationship between the number of classes they missed and their final grades. The accompanying table shows these data for a random sample of nine students. Complete parts a through c. Click the icon to view the table showing missed classes and final grade. a. Calculate the correlation coefficient for this sample. The correlation coefficient is I. (Type an integer...
 Click here to view the data set. Click here to view the critical values table. i Data set o LLLL 10 10 x y 2 4 4 8 6 10 6 13 7 19 (b) By hand, compute the correlation coefficient. The correlation coefficient is r= (Round to three decimal places as needed.) Print Done (c) Determine whether there is a linear relation between x and y. Because the correlation coefficient is and the absolute value of the correlation coefficient,...
 The following data represent the calories and sugar, in grams, of various breakfast cereals. Product A B с D E F G Calories 260 380 390 410 460 540 590 Sugar 8.7 5.1 21.5 21.4 16.5 22.3 24.2 Use the data above to complete parts (a) through (d). a. Compute the covariance. 742.000 (Round to three decimal places as needed.) b. Compute the coefficient of correlation. r= 0.690 (Round to three decimal places as needed.) c. Which do you think...
 Use the given confidence level and sample data to find (a) the margin of error and (b) the confidence interval for the population mean u. Assume that the population has a normal distribution. Weight lost on a diet: 90% confidence; n 20, x= 7.0 kg, s 9.2 kg. Click the icon to view a table of critical t-values. kg (Round to one decimal place as needed.) (a) E (b) What is the confidence interval for the population mean u? kg<u...
 The best predicted number of Nobel
Laureates when the number of internet users per 100 is 78.4 is
....... round to one decimal place as needed
The best predicted gross for a movie with a $10 million budget
is ...........million. (Round to one decimal place as
needed.)
Find the regression equation, letting the first variable be the predictor (x) variable. Find the best predicted Nobel Laureate rate for a country that has 78.4 Internet users per 100 people. How does...
The best predicted number of Nobel
Laureates when the number of internet users per 100 is 78.4 is
....... round to one decimal place as needed
The best predicted gross for a movie with a $10 million budget
is ...........million. (Round to one decimal place as
needed.)
Find the regression equation, letting the first variable be the predictor (x) variable. Find the best predicted Nobel Laureate rate for a country that has 78.4 Internet users per 100 people. How does...
 The amounts of a chemical compound y that dissolved in 100 grams of water at various temperatures x were recorded. Use the given data to complete parts (a) through (c) below. EEB Click the icon to view the recorded data. (a) Find the equation of the regression line. (Round the constant to two decimal places as needed. Round the coefficient to three decimal places as needed.) (b) Graph the line on a scatter diagram. Choose the correct graph below. O...
Most questions answered within 3 hours.
-
Where is the error in this code sequence?
String s1 = "Hello";
String s2 = "ello";...
asked 11 months ago -
Financial data for Joel de Paris, Inc., for last year
follow:
Joel de Paris, Inc.
Balance...
asked 11 months ago -
Consider this reaction:
Al2(SO4)3 (aq)+ BaCl3
(aq) Al2Cl6 (aq)- +
3BaSO4(s) . What is the...
asked 11 months ago -
Suppose that Savneet is considering increasing her
recent random sample from 20 car rentals to 40...
asked 11 months ago -
Trucks arrive at an unloading terminal at an average rate of 120
per hour.
Trucks arrive...
asked 11 months ago -
Why are methanol and ethanol completely soluble in water while
octanol is not very little soluble....
asked 11 months ago -
A facilities manager at a university reads in a research report
that the mean amount of...
asked 11 months ago -
When the CuSO4 is rehydrated by adding water to the anhydrous
compound, is this an endothermic...
asked 11 months ago -
A ray of sunlight is passing from diamond into crown glass; the
angle of incidence is...
asked 11 months ago -
A block of mass 0.249 kg is placed on top of a light, vertical
spring of...
asked 11 months ago -
how do the kidneys compensate in the presences of acidosis
a) trigger hyperventilate
b) reserve acid...
asked 11 months ago -
Question 501 pts
The rental rate of capital to the firm increases. Which of the
following...
asked 11 months ago