Here is the Neth.CSV data link. (The data file is given follow the question. It is not an external source)
https://drive.google.com/open?id=0B-LWYF9pJQgUanZicHZXMHVsbTBHTmd2TUxIWGd2LU9VTUJV
Please show the R commands used and
Plots, thanks!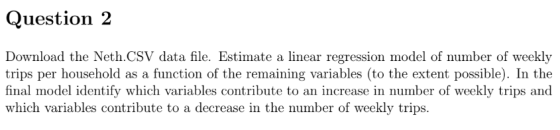

Homework Answers

![> #D[,7]&D[, 8] decreses weekly trip rest of the variable increases > #these variables p-value is >0.05 indicates that they h](http://img.homeworklib.com/questions/42793050-8b7f-11ec-a9ad-c7ae3e78d104.png?x-oss-process=image/resize,w_560)
Add Answer to:
Here is the Neth.CSV data link. (The data file
is given follow the question. It is...
Use the Manufacturing database from “Excel Databases.xls” (Google drive link below). Use Excel to develop a...
Use the Manufacturing database from “Excel Databases.xls” (Google drive link below). Use Excel to develop a multiple regression model to predict Cost of Materials by Number of Employees, Number of Products, Value Added by Manufacture, New Capital Expenditures, and End-of-Year Inventories. Does multicollinearity seem to be a problem in this analysis? Use Excel to create the correlation matrix that includes all 5 of the independent variables in this study. Which two independent variables have the highest correlation? Select 2 answers...
Use the Financial database from “Excel Databases.xls” (Google drive link below). Use Total Revenues, Total Assets, Retur...
Use the Financial database from “Excel Databases.xls” (Google drive link below). Use Total Revenues, Total Assets, Return on Equity, Earnings Per Share, Average Yield, and Dividends Per Share to predict the average P/E ratio for a company. Use Excel to perform a forward selection regression analysis. Assume a 5% level of significance. Which independent variables are in the final model? Select all that apply. Total Revenues Total Assets Return on Equity Earnings Per Share Average Yield Dividends Per Share https://drive.google.com/file/d/1yT22MXE0QAFJ0IOFMJosHCnqVTORiLM-/view?usp=sharing
Excel Data: https://drive.google.com/file/d/1TQG5r2wzLGk--75whZXyb0SDTHZTWS0S/view?usp=sharing QUESTION 8 Use the Financial database from "Excel Databases.xls" on Blackboard. Use Total...
 Excel Data:
https://drive.google.com/file/d/1TQG5r2wzLGk--75whZXyb0SDTHZTWS0S/view?usp=sharing
QUESTION 8 Use the Financial database from "Excel Databases.xls" on Blackboard. Use Total Revenues, Total Assets, Return on Equity, Earnings Per Share, Average Yield, and Dividends Per Share to predict the average P/E ratio for a company. Use Excel to develop the multiple linear regression model Is the overall model significant at a 5% level of significance? Support your answer using the p-value O Yes, the pvalue 0.00000396 is less than the 5% level of significance. O...
Excel Data:
https://drive.google.com/file/d/1TQG5r2wzLGk--75whZXyb0SDTHZTWS0S/view?usp=sharing
QUESTION 8 Use the Financial database from "Excel Databases.xls" on Blackboard. Use Total Revenues, Total Assets, Return on Equity, Earnings Per Share, Average Yield, and Dividends Per Share to predict the average P/E ratio for a company. Use Excel to develop the multiple linear regression model Is the overall model significant at a 5% level of significance? Support your answer using the p-value O Yes, the pvalue 0.00000396 is less than the 5% level of significance. O...
Subject : Visualizing Data in Python with Matplotlib Topic : Exploring Data Visually with Matplotlib using...
Subject : Visualizing Data in Python with Matplotlib Topic : Exploring Data Visually with Matplotlib using Dictionaries Begin by reviewing the matplotlib documentation and the User Guide. Here we will make a histogram using some data from the Loan Stats Q1 2019 file. (Loan Stats Q1 2019 Download File Link : - https://www.lendingclub.com/info/download-data.action) Explore the user guide and then review this example : ( https://matplotlib.org/gallery/lines_bars_and_markers/categorical_variables.html) Question: Submit code demonstrating the following: Using the Loan Stats file, construct a dictionary containing...
How do I include the data? The site keeps telling me the question is too long when I include it and when I try to add th...
How do I include the data? The site keeps telling me the question is too long when I include it and when I try to add the 2 pictures it will only let me add one pic. With milk sales sagging of late, The Milk Processor Education Program (MPEP) decided to move on from the famous "Got Milk" ad slogan in favor of a new one, "Milk Life." The new tagline emphasizes milk's nutritional benefits, including its protein content. MPEP...
1. Table of descriptive statistical measures (arithmetic mean, standard deviation, smallest value and largest value) for the variables in the model with a detailed discussion of the table 2. The equation is in the community form of the model you reached,
1. Table of descriptive statistical measures (arithmetic mean, standard deviation, smallest value and largest value) for the variables in the model with a detailed discussion of the table2. The equation is in the community form of the model you reached, then display the results of the estimated equation from the Gretl program with errors. Standard normal as well again with proper standard errors.3. Discuss and explain the results of the estimated model and then the number of reasons why the...
Locate Hospital Tab on Excel Data. View Data:https://drive.google.com/file/d/1HMgLG7BVcvpoQ6iUxjk...
 Locate Hospital Tab on Excel Data. View
Data:https://drive.google.com/file/d/1HMgLG7BVcvpoQ6iUxjkL_xCBzvpgHhHp/view?usp=sharing
Problem 1 What is a better predictor of the number of Personnel in a hospital? Using the "Excel Databases.xls" file, locate the tab for the Hospital Database. Use Excel to develop two simple regression models for the Hospital Database at a 5% significance level Model 1: Predict the number of Personnel by the number of Births Model 2: Predict number of Personnel by number of Beds Must complete all the parts to...
Locate Hospital Tab on Excel Data. View
Data:https://drive.google.com/file/d/1HMgLG7BVcvpoQ6iUxjkL_xCBzvpgHhHp/view?usp=sharing
Problem 1 What is a better predictor of the number of Personnel in a hospital? Using the "Excel Databases.xls" file, locate the tab for the Hospital Database. Use Excel to develop two simple regression models for the Hospital Database at a 5% significance level Model 1: Predict the number of Personnel by the number of Births Model 2: Predict number of Personnel by number of Beds Must complete all the parts to...
Question 312 marks An study was conducted using data from pedometers of 68 randomly selected part...
 Question 312 marks An study was conducted using data from pedometers of 68 randomly selected participants. The researchers wanted to know if the number of steps taken by a participant (Steps) could be predicted using the time they spent walking (Minutes). The data are available on MyUni in the file Steps.csv. 2 (a) Produce a scatterplot of Steps vs Minutes and describe any relationship between these two variables. (b) Perform a linear regression analysis on this data in MATLAB and...
In this exercise use the Peruvian blood pressure data set, provided in the file peruvian.txt. Thi...
 In this exercise use the Peruvian blood pressure data set,
provided in the file peruvian.txt. This dataset consists of
variables possibly relating to blood pressures of n = 39 Peruvians
who have moved from rural high altitude areas to urban lower
altitude areas. The variables in this dataset are: Age, Years,
Weight, Height, Calf, Pulse, Systol and Diastol. Before reading the
data intoMATLAB, it can be viewed in a text editor.
This question involves the use of multiple linear regression...
In this exercise use the Peruvian blood pressure data set,
provided in the file peruvian.txt. This dataset consists of
variables possibly relating to blood pressures of n = 39 Peruvians
who have moved from rural high altitude areas to urban lower
altitude areas. The variables in this dataset are: Age, Years,
Weight, Height, Calf, Pulse, Systol and Diastol. Before reading the
data intoMATLAB, it can be viewed in a text editor.
This question involves the use of multiple linear regression...
 Excel Data:
https://drive.google.com/file/d/1TQG5r2wzLGk--75whZXyb0SDTHZTWS0S/view?usp=sharing
QUESTION 8 Use the Financial database from "Excel Databases.xls" on Blackboard. Use Total Revenues, Total Assets, Return on Equity, Earnings Per Share, Average Yield, and Dividends Per Share to predict the average P/E ratio for a company. Use Excel to develop the multiple linear regression model Is the overall model significant at a 5% level of significance? Support your answer using the p-value O Yes, the pvalue 0.00000396 is less than the 5% level of significance. O...
Excel Data:
https://drive.google.com/file/d/1TQG5r2wzLGk--75whZXyb0SDTHZTWS0S/view?usp=sharing
QUESTION 8 Use the Financial database from "Excel Databases.xls" on Blackboard. Use Total Revenues, Total Assets, Return on Equity, Earnings Per Share, Average Yield, and Dividends Per Share to predict the average P/E ratio for a company. Use Excel to develop the multiple linear regression model Is the overall model significant at a 5% level of significance? Support your answer using the p-value O Yes, the pvalue 0.00000396 is less than the 5% level of significance. O...
 Locate Hospital Tab on Excel Data. View
Data:https://drive.google.com/file/d/1HMgLG7BVcvpoQ6iUxjkL_xCBzvpgHhHp/view?usp=sharing
Problem 1 What is a better predictor of the number of Personnel in a hospital? Using the "Excel Databases.xls" file, locate the tab for the Hospital Database. Use Excel to develop two simple regression models for the Hospital Database at a 5% significance level Model 1: Predict the number of Personnel by the number of Births Model 2: Predict number of Personnel by number of Beds Must complete all the parts to...
Locate Hospital Tab on Excel Data. View
Data:https://drive.google.com/file/d/1HMgLG7BVcvpoQ6iUxjkL_xCBzvpgHhHp/view?usp=sharing
Problem 1 What is a better predictor of the number of Personnel in a hospital? Using the "Excel Databases.xls" file, locate the tab for the Hospital Database. Use Excel to develop two simple regression models for the Hospital Database at a 5% significance level Model 1: Predict the number of Personnel by the number of Births Model 2: Predict number of Personnel by number of Beds Must complete all the parts to...
 Question 312 marks An study was conducted using data from pedometers of 68 randomly selected participants. The researchers wanted to know if the number of steps taken by a participant (Steps) could be predicted using the time they spent walking (Minutes). The data are available on MyUni in the file Steps.csv. 2 (a) Produce a scatterplot of Steps vs Minutes and describe any relationship between these two variables. (b) Perform a linear regression analysis on this data in MATLAB and...
 In this exercise use the Peruvian blood pressure data set,
provided in the file peruvian.txt. This dataset consists of
variables possibly relating to blood pressures of n = 39 Peruvians
who have moved from rural high altitude areas to urban lower
altitude areas. The variables in this dataset are: Age, Years,
Weight, Height, Calf, Pulse, Systol and Diastol. Before reading the
data intoMATLAB, it can be viewed in a text editor.
This question involves the use of multiple linear regression...
In this exercise use the Peruvian blood pressure data set,
provided in the file peruvian.txt. This dataset consists of
variables possibly relating to blood pressures of n = 39 Peruvians
who have moved from rural high altitude areas to urban lower
altitude areas. The variables in this dataset are: Age, Years,
Weight, Height, Calf, Pulse, Systol and Diastol. Before reading the
data intoMATLAB, it can be viewed in a text editor.
This question involves the use of multiple linear regression...
Most questions answered within 3 hours.
-
Where is the error in this code sequence?
String s1 = "Hello";
String s2 = "ello";...
asked 11 months ago -
Financial data for Joel de Paris, Inc., for last year
follow:
Joel de Paris, Inc.
Balance...
asked 11 months ago -
Consider this reaction:
Al2(SO4)3 (aq)+ BaCl3
(aq) Al2Cl6 (aq)- +
3BaSO4(s) . What is the...
asked 11 months ago -
Suppose that Savneet is considering increasing her
recent random sample from 20 car rentals to 40...
asked 11 months ago -
Trucks arrive at an unloading terminal at an average rate of 120
per hour.
Trucks arrive...
asked 11 months ago -
Why are methanol and ethanol completely soluble in water while
octanol is not very little soluble....
asked 11 months ago -
A facilities manager at a university reads in a research report
that the mean amount of...
asked 11 months ago -
When the CuSO4 is rehydrated by adding water to the anhydrous
compound, is this an endothermic...
asked 11 months ago -
A ray of sunlight is passing from diamond into crown glass; the
angle of incidence is...
asked 11 months ago -
A block of mass 0.249 kg is placed on top of a light, vertical
spring of...
asked 11 months ago -
how do the kidneys compensate in the presences of acidosis
a) trigger hyperventilate
b) reserve acid...
asked 11 months ago -
Question 501 pts
The rental rate of capital to the firm increases. Which of the
following...
asked 11 months ago