
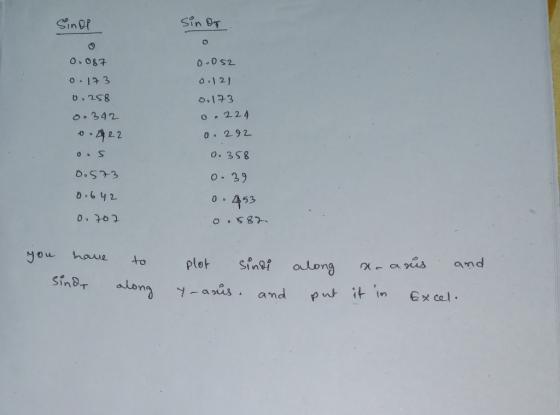
Plot a graph of sin(θi) versus sin(θr)
I can't seem to get it to plot correctly in excel. Can you walk me through the steps to get this to plot? Make sure it's step by step, what to pick for a graph type, x and y etc..
Homework Answers

Add Answer to:
Plot a graph of sin(θi) versus
sin(θr)
I can't seem to get it to plot correctly...
the question also says to use snell's law to find the ratio. but i am kind...
 the
question also says to use snell's law to find the ratio. but i am
kind of confused as to how to do this using the graph and line of
best fit. please help..!
8. Submit, along with this report file, a scatter plot of sin 02 as a function of sino 1 0.9 0.8 0.7 0.6 Sin theta 2 0.5 0.4 0.3 0.2 0.1 0 0 0.2 y = 0.2442x + 0.2471 0.4 0.8 1 1.2 0.6 Sin theta...
the
question also says to use snell's law to find the ratio. but i am
kind of confused as to how to do this using the graph and line of
best fit. please help..!
8. Submit, along with this report file, a scatter plot of sin 02 as a function of sino 1 0.9 0.8 0.7 0.6 Sin theta 2 0.5 0.4 0.3 0.2 0.1 0 0 0.2 y = 0.2442x + 0.2471 0.4 0.8 1 1.2 0.6 Sin theta...
Questions: Plot a graph showing sin θ₁ versus sin θ₂ for your data. Equation 2 will...
 Questions:
Plot a graph showing sin θ₁ versus sin θ₂ for
your data. Equation 2 will be used to solve for
n₂.
1. Use a linear fit to plot the data and find slope of the line
to help determine a value for the index of refraction for the
acrylic lens (n₂). Assume that the index of
refraction for air (n₁) is 1. Record your
experimental value here:
n₂=
2. If acrylic glass has a theoretical index of refraction of...
Questions:
Plot a graph showing sin θ₁ versus sin θ₂ for
your data. Equation 2 will be used to solve for
n₂.
1. Use a linear fit to plot the data and find slope of the line
to help determine a value for the index of refraction for the
acrylic lens (n₂). Assume that the index of
refraction for air (n₁) is 1. Record your
experimental value here:
n₂=
2. If acrylic glass has a theoretical index of refraction of...
1- Larry Davis borrows $73,000 at 12 percent interest toward the purchase of a home. His...
 1- Larry Davis borrows $73,000 at 12 percent interest toward the
purchase of a home. His mortgage is for 30 years. Use Appendix D
for an approximate answer, but calculate your final answer using
the formula and financial calculator methods.
a. How much will his annual payments be?
(Although home payments are usually on a monthly basis, we shall do
our analysis on an annual basis for ease of computation. We will
get a reasonably accurate answer.)
b. How much...
1- Larry Davis borrows $73,000 at 12 percent interest toward the
purchase of a home. His mortgage is for 30 years. Use Appendix D
for an approximate answer, but calculate your final answer using
the formula and financial calculator methods.
a. How much will his annual payments be?
(Although home payments are usually on a monthly basis, we shall do
our analysis on an annual basis for ease of computation. We will
get a reasonably accurate answer.)
b. How much...
 the
question also says to use snell's law to find the ratio. but i am
kind of confused as to how to do this using the graph and line of
best fit. please help..!
8. Submit, along with this report file, a scatter plot of sin 02 as a function of sino 1 0.9 0.8 0.7 0.6 Sin theta 2 0.5 0.4 0.3 0.2 0.1 0 0 0.2 y = 0.2442x + 0.2471 0.4 0.8 1 1.2 0.6 Sin theta...
the
question also says to use snell's law to find the ratio. but i am
kind of confused as to how to do this using the graph and line of
best fit. please help..!
8. Submit, along with this report file, a scatter plot of sin 02 as a function of sino 1 0.9 0.8 0.7 0.6 Sin theta 2 0.5 0.4 0.3 0.2 0.1 0 0 0.2 y = 0.2442x + 0.2471 0.4 0.8 1 1.2 0.6 Sin theta...
 Questions:
Plot a graph showing sin θ₁ versus sin θ₂ for
your data. Equation 2 will be used to solve for
n₂.
1. Use a linear fit to plot the data and find slope of the line
to help determine a value for the index of refraction for the
acrylic lens (n₂). Assume that the index of
refraction for air (n₁) is 1. Record your
experimental value here:
n₂=
2. If acrylic glass has a theoretical index of refraction of...
Questions:
Plot a graph showing sin θ₁ versus sin θ₂ for
your data. Equation 2 will be used to solve for
n₂.
1. Use a linear fit to plot the data and find slope of the line
to help determine a value for the index of refraction for the
acrylic lens (n₂). Assume that the index of
refraction for air (n₁) is 1. Record your
experimental value here:
n₂=
2. If acrylic glass has a theoretical index of refraction of...
 1- Larry Davis borrows $73,000 at 12 percent interest toward the
purchase of a home. His mortgage is for 30 years. Use Appendix D
for an approximate answer, but calculate your final answer using
the formula and financial calculator methods.
a. How much will his annual payments be?
(Although home payments are usually on a monthly basis, we shall do
our analysis on an annual basis for ease of computation. We will
get a reasonably accurate answer.)
b. How much...
1- Larry Davis borrows $73,000 at 12 percent interest toward the
purchase of a home. His mortgage is for 30 years. Use Appendix D
for an approximate answer, but calculate your final answer using
the formula and financial calculator methods.
a. How much will his annual payments be?
(Although home payments are usually on a monthly basis, we shall do
our analysis on an annual basis for ease of computation. We will
get a reasonably accurate answer.)
b. How much...
Most questions answered within 3 hours.
-
Where is the error in this code sequence?
String s1 = "Hello";
String s2 = "ello";...
asked 10 months ago -
Financial data for Joel de Paris, Inc., for last year
follow:
Joel de Paris, Inc.
Balance...
asked 10 months ago -
Consider this reaction:
Al2(SO4)3 (aq)+ BaCl3
(aq) Al2Cl6 (aq)- +
3BaSO4(s) . What is the...
asked 10 months ago -
Suppose that Savneet is considering increasing her
recent random sample from 20 car rentals to 40...
asked 10 months ago -
Trucks arrive at an unloading terminal at an average rate of 120
per hour.
Trucks arrive...
asked 10 months ago -
Why are methanol and ethanol completely soluble in water while
octanol is not very little soluble....
asked 10 months ago -
A facilities manager at a university reads in a research report
that the mean amount of...
asked 10 months ago -
When the CuSO4 is rehydrated by adding water to the anhydrous
compound, is this an endothermic...
asked 10 months ago -
A ray of sunlight is passing from diamond into crown glass; the
angle of incidence is...
asked 10 months ago -
A block of mass 0.249 kg is placed on top of a light, vertical
spring of...
asked 10 months ago -
how do the kidneys compensate in the presences of acidosis
a) trigger hyperventilate
b) reserve acid...
asked 10 months ago -
Question 501 pts
The rental rate of capital to the firm increases. Which of the
following...
asked 10 months ago