Please solve 2.7, 2.8 and 2.9 problems.
Homework Answers
Solution:
27) We are given that:
 Vs
Vs 
Sample sizes are n1 = n2 = 10
Variances are unknown but assumed equal.
We have to find bounds on P-value for the following observed values
of the test statistic.
Since
is right tailed , we use one tail area for finding P-value
intervals.
df = n1 + n2 - 2 = 10 + 10 - 2 = 18
So we look in t table for row of df = 18 and find the interval in which t test statistic fall.
Part a) t0 = 2.31
Look in t table for df row = 18 and find the interval in which t = 2.31 fall , then find corresponding one tail area interval, which would be bounds on P-value.

t0 = 2.31 fall in between t = 2.101 to t = 2.552, thus corresponding one tail area is in between 0.01 to 0.025
Thus bounds on P-value are:
0.01 < P-value < 0.025
Part b) t0 = 3.60
Look in t table for df row = 18 and find the interval in which t = 3.60 fall , then find corresponding one tail area interval, which would be bounds on P-value.

t0 = 3.60 fall in between t = 2.878 to t = 3.610, thus corresponding one tail area is in between 0.001 to 0.005
Thus bounds on P-value are:
0.001 < P-value < 0.005
Part c) t0 = 1.95
Look in t table for df row = 18 and find the interval in which t = 1.95 fall , then find corresponding one tail area interval, which would be bounds on P-value.

t0 = 1.95 fall in between t = 1.734 to t = 2.101, thus corresponding one tail area is in between 0.025 to 0.05
Thus bounds on P-value are:
0.025 < P-value < 0.05
Part d) t0 = 2.19
Look in t table for df row = 18 and find the interval in which t = 2.19 fall , then find corresponding one tail area interval, which would be bounds on P-value.

t0 = 2.19 fall in between t = 2.101 to t = 2.552, thus corresponding one tail area is in between 0.01 to 0.025
Thus bounds on P-value are:
0.01 < P-value < 0.025
Add Answer to:
Please solve 2.7, 2.8 and 2.9 problems.
2.7. Suppose that we are testing Ho : μ1...
Suppose that you are testing the following hypotheses: Ho: = 10 and 11: > 10. If...
 Suppose that you are testing the following hypotheses: Ho: = 10 and 11: > 10. If the null hypothesis is rejected at the 1% level of significance, what statement can you make about the confidence interval on the mean? a) The lower bound of a 95% one-sided confidence interval on the mean exceeds 10. b) 9 sus 13 c) No statement can be made. d) The lower bound of a 95% one-sided confidence interval on the mean exceeds zero. If...
Bonus (5 points) Suppose that you are testing the following hypotheses: Ho: 4 = 10 and...
 Bonus (5 points) Suppose that you are testing the following hypotheses: Ho: 4 = 10 and H :> 10. If the null hypothesis is rejected at the 1% level of significance, what statement can you make about the confidence interval on the mean? a) The lower bound of a 95% one-sided confidence interval on the mean exceeds 10. b) 9 <u< 13 c) No statement can be made. d) The lower bound of a 95% one-sided confidence interval on the...
This question is based on Ch10, but we can solve it using our knowledge from Ch9....
This question is based on Ch10, but we can solve it using our knowledge from Ch9. In Ch 8, we created confidence intervals to test whether the means differed in a statistically significant manner between two independent (unrelated) populations, like males and females. The sample point estimator in the confidence interval was the difference in the sample means between the 2 samples (xbar - ybar). We created a confidence interval of the form: (xbar-ybar) +/- (Zα/2)[standard error of (xbar-ybar)] We...
Suppose that we are testing H 0 : μ 1 = μ 2 versus H 0...
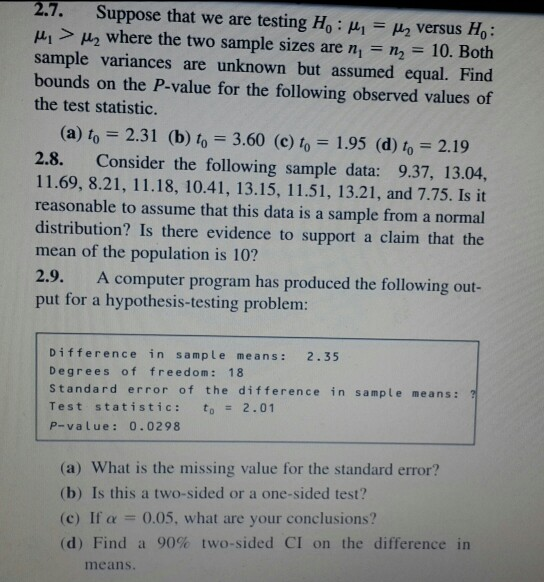
Suppose that we are testing H 0 : μ 1 = μ 2 versus H 0 : μ 1 > μ 2 where the two sample sizes are n 1 = n 2 = 10 . Both sample variances are unknown but assumed equal. Find bounds on the P-value for the following observed values of the test statistic. t0=2.31 t0=3.60 t0=1.95 t0=2.19 Please do it by hand and show tables if they are used. Be detailed
These two groups are two samples representing the population of workers in the economy. We want t...
 These two groups are two samples representing the population of
workers in the economy. We want to know if the workers who take the
training (treatment sample) have higher earnings than the group
that do not take the training (control sample). If we find that the
trained workers have higher earnings it would indicate that the
training is effective.[1]In terms of statistics, we will do a
hypothesis test on the difference between the mean earnings in the
treatment population and...
These two groups are two samples representing the population of
workers in the economy. We want to know if the workers who take the
training (treatment sample) have higher earnings than the group
that do not take the training (control sample). If we find that the
trained workers have higher earnings it would indicate that the
training is effective.[1]In terms of statistics, we will do a
hypothesis test on the difference between the mean earnings in the
treatment population and...
answer the exibit with an explanation please Exhibit 16-1 Salary information regarding male and female employees...
 answer the exibit with an explanation please
Exhibit 16-1 Salary information regarding male and female employees of a large company is shown below. Mals Female Sample Sure 36 Sample Mean Salary (in $1,000) Population Variance (0) 128 3. Refer to Exhibit 10-1. The point estimate of the difference between the means of the two populations is b. 3 C4 d 4 ANS: B 4. Refer to Exhibit 10-1. The standard error for the difference between the two means is b....
answer the exibit with an explanation please
Exhibit 16-1 Salary information regarding male and female employees of a large company is shown below. Mals Female Sample Sure 36 Sample Mean Salary (in $1,000) Population Variance (0) 128 3. Refer to Exhibit 10-1. The point estimate of the difference between the means of the two populations is b. 3 C4 d 4 ANS: B 4. Refer to Exhibit 10-1. The standard error for the difference between the two means is b....
8. A random sample of 25 college males was obtained and each was asked to report...
 8. A random sample of 25 college males was obtained and each was
asked to report their actual height and what they wished as their
ideal height. A 95% confidence interval for μd= average difference
between their ideal and actual heights was 0.8" to 2.2". Based on
this interval, which one of the null hypotheses below (versus a
two-sided alternative)can be rejected?
A. H0: μd= 0.5
B. H0: μd= 1.0
C. H0: μd= 1.5
D. H0: μd= 2.0
9. The...
8. A random sample of 25 college males was obtained and each was
asked to report their actual height and what they wished as their
ideal height. A 95% confidence interval for μd= average difference
between their ideal and actual heights was 0.8" to 2.2". Based on
this interval, which one of the null hypotheses below (versus a
two-sided alternative)can be rejected?
A. H0: μd= 0.5
B. H0: μd= 1.0
C. H0: μd= 1.5
D. H0: μd= 2.0
9. The...
John has obtained two independent samples from two populations, where the sample statistics are shown in...
John has obtained two independent samples from two populations, where the sample statistics are shown in the table below. Assuming equal variances, he can construct a 95 percent confidence interval for the difference of the population means to be Sample 1 Sample 2 Mean 22.7 20.5 Variance (s^2) 5.4 3.6 Observations (sample size) 9 9 [0.08, 4.32] [1.17, 5.08] [2.44,6.19] [-0.09, 3.19] A corporate analyst is testing whether mean inventory turnover has increased. Inventory turnover in six randomly chosen product...
eBook Video Exercise 10.1 (Algorithmic)) Consider the following results for two independent random samples taken from...
 eBook Video Exercise 10.1 (Algorithmic)) Consider the following results for two independent random samples taken from two populations. Sample 1 Sample 2 n 50 n2 35 1-1=13.6 X2= 11.1 a. What is the point estimate of the difference between the two population means? | b. Provide a 90% confidence interval for the difference between the two population means (to 2 decimals). c Provide a 95% confidence interval for the difference between the two population means to 2 decimals eBook Video...
 Suppose that you are testing the following hypotheses: Ho: = 10 and 11: > 10. If the null hypothesis is rejected at the 1% level of significance, what statement can you make about the confidence interval on the mean? a) The lower bound of a 95% one-sided confidence interval on the mean exceeds 10. b) 9 sus 13 c) No statement can be made. d) The lower bound of a 95% one-sided confidence interval on the mean exceeds zero. If...
 Bonus (5 points) Suppose that you are testing the following hypotheses: Ho: 4 = 10 and H :> 10. If the null hypothesis is rejected at the 1% level of significance, what statement can you make about the confidence interval on the mean? a) The lower bound of a 95% one-sided confidence interval on the mean exceeds 10. b) 9 <u< 13 c) No statement can be made. d) The lower bound of a 95% one-sided confidence interval on the...
 These two groups are two samples representing the population of
workers in the economy. We want to know if the workers who take the
training (treatment sample) have higher earnings than the group
that do not take the training (control sample). If we find that the
trained workers have higher earnings it would indicate that the
training is effective.[1]In terms of statistics, we will do a
hypothesis test on the difference between the mean earnings in the
treatment population and...
These two groups are two samples representing the population of
workers in the economy. We want to know if the workers who take the
training (treatment sample) have higher earnings than the group
that do not take the training (control sample). If we find that the
trained workers have higher earnings it would indicate that the
training is effective.[1]In terms of statistics, we will do a
hypothesis test on the difference between the mean earnings in the
treatment population and...
 answer the exibit with an explanation please
Exhibit 16-1 Salary information regarding male and female employees of a large company is shown below. Mals Female Sample Sure 36 Sample Mean Salary (in $1,000) Population Variance (0) 128 3. Refer to Exhibit 10-1. The point estimate of the difference between the means of the two populations is b. 3 C4 d 4 ANS: B 4. Refer to Exhibit 10-1. The standard error for the difference between the two means is b....
answer the exibit with an explanation please
Exhibit 16-1 Salary information regarding male and female employees of a large company is shown below. Mals Female Sample Sure 36 Sample Mean Salary (in $1,000) Population Variance (0) 128 3. Refer to Exhibit 10-1. The point estimate of the difference between the means of the two populations is b. 3 C4 d 4 ANS: B 4. Refer to Exhibit 10-1. The standard error for the difference between the two means is b....
 8. A random sample of 25 college males was obtained and each was
asked to report their actual height and what they wished as their
ideal height. A 95% confidence interval for μd= average difference
between their ideal and actual heights was 0.8" to 2.2". Based on
this interval, which one of the null hypotheses below (versus a
two-sided alternative)can be rejected?
A. H0: μd= 0.5
B. H0: μd= 1.0
C. H0: μd= 1.5
D. H0: μd= 2.0
9. The...
8. A random sample of 25 college males was obtained and each was
asked to report their actual height and what they wished as their
ideal height. A 95% confidence interval for μd= average difference
between their ideal and actual heights was 0.8" to 2.2". Based on
this interval, which one of the null hypotheses below (versus a
two-sided alternative)can be rejected?
A. H0: μd= 0.5
B. H0: μd= 1.0
C. H0: μd= 1.5
D. H0: μd= 2.0
9. The...
 eBook Video Exercise 10.1 (Algorithmic)) Consider the following results for two independent random samples taken from two populations. Sample 1 Sample 2 n 50 n2 35 1-1=13.6 X2= 11.1 a. What is the point estimate of the difference between the two population means? | b. Provide a 90% confidence interval for the difference between the two population means (to 2 decimals). c Provide a 95% confidence interval for the difference between the two population means to 2 decimals eBook Video...
Most questions answered within 3 hours.
-
Where is the error in this code sequence?
String s1 = "Hello";
String s2 = "ello";...
asked 10 months ago -
Financial data for Joel de Paris, Inc., for last year
follow:
Joel de Paris, Inc.
Balance...
asked 10 months ago -
Consider this reaction:
Al2(SO4)3 (aq)+ BaCl3
(aq) Al2Cl6 (aq)- +
3BaSO4(s) . What is the...
asked 10 months ago -
Suppose that Savneet is considering increasing her
recent random sample from 20 car rentals to 40...
asked 10 months ago -
Trucks arrive at an unloading terminal at an average rate of 120
per hour.
Trucks arrive...
asked 10 months ago -
Why are methanol and ethanol completely soluble in water while
octanol is not very little soluble....
asked 10 months ago -
A facilities manager at a university reads in a research report
that the mean amount of...
asked 10 months ago -
When the CuSO4 is rehydrated by adding water to the anhydrous
compound, is this an endothermic...
asked 10 months ago -
A ray of sunlight is passing from diamond into crown glass; the
angle of incidence is...
asked 10 months ago -
A block of mass 0.249 kg is placed on top of a light, vertical
spring of...
asked 10 months ago -
how do the kidneys compensate in the presences of acidosis
a) trigger hyperventilate
b) reserve acid...
asked 10 months ago -
Question 501 pts
The rental rate of capital to the firm increases. Which of the
following...
asked 10 months ago