Given that I have a population with the following content: [1,2,4,6,2,6,3,7,9]. What command in R programming...
Given that I have a population with the following content: [1,2,4,6,2,6,3,7,9]. What command in R programming I should use to:
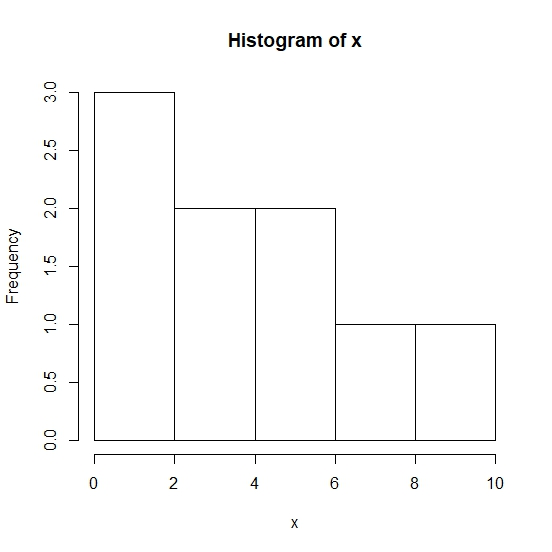
1) "Visually"(not just data) describe this population?
2) If I take a random sample of size 3 from this population?How to
find it proportion of 0's and 1's in this sample?
Thank you in advance!
Homework Answers
2
>x=c(1,2,4,6,2,6,3,7,9)
>x
>y=sample(c(0,1),replace=TRUE,length(x))
>y
>z=y[y==0]
>z
>prop=length(z)/(length(x)-length(z))
>prop
this is the program
for exmple
> x=c(1,2,4,6,2,6,3,7,9)
> x
[1] 1 2 4 6 2 6 3 7 9
> y=sample(c(0,1),replace=TRUE,length(x))
> y
[1] 0 1 1 1 0 1 1 0 1
> z=y[y==0]
> z
[1] 0 0 0
> prop=length(z)/(length(x)-length(z))
> prop
[1] 0.5
Add Answer to:
Given that I have a population with the following content:
[1,2,4,6,2,6,3,7,9]. What command in R programming...
what i currently have is wrong...thanks in advance! A 95% confidence interval for a population proportion...
 what i currently have is wrong...thanks in advance!
A 95% confidence interval for a population proportion was constructed using a sample proportion from a random sample. Which of the following statements are correct? Select all that apply If we were to use a 90% confidence level, the confidence interval from the same data would produce an interval wider than the 95% confidence interval. There is a 95% chance that the 95% confidence interval actually contains the population proportion. We don't...
what i currently have is wrong...thanks in advance!
A 95% confidence interval for a population proportion was constructed using a sample proportion from a random sample. Which of the following statements are correct? Select all that apply If we were to use a 90% confidence level, the confidence interval from the same data would produce an interval wider than the 95% confidence interval. There is a 95% chance that the 95% confidence interval actually contains the population proportion. We don't...
Use the given degree of confidence and sample data to construct a confidence interval for the population proportion p....
 Use the given degree of confidence and sample data to construct a confidence interval for the population proportion p. Round to three decimal palces Of 98 adults selected random from one town, 68 have health insurance Find a 90% confidence interval adults in he own who have heal e proportion on r e a ns rance 0585 < p < 0 802 B. 0.617<p<0.770 A. C. 0603 p<0.785 D. 0.574p<0.814
Use the given degree of confidence and sample data to...
Use the given degree of confidence and sample data to construct a confidence interval for the population proportion p. Round to three decimal palces Of 98 adults selected random from one town, 68 have health insurance Find a 90% confidence interval adults in he own who have heal e proportion on r e a ns rance 0585 < p < 0 802 B. 0.617<p<0.770 A. C. 0603 p<0.785 D. 0.574p<0.814
Use the given degree of confidence and sample data to...
2) Use the given data to find the minimum sample size required to estimate the population...
 2) Use the given data to find the minimum sample size required to estimate the population proportion. Margin of error: 0.058; confidence level: 90%; and unknown sample proportion p^. 0 201 0223 O 202 0 222 JUL 3 D 31 ER
Use the given data to find the minimum sample size required to estimate the population proportion....
Use the given data to find the minimum sample size required to estimate the population proportion. Margin of error: 0.089; confidence level: 99%; and unknown sample proportion p^
Please help with the below. Thank you! Please use R Console: I have to create a...
Please help with the below. Thank you! Please use R Console: I have to create a command in R console so that below all has 3 bins. Below is the data: 107 194 146 40 8 4 1 Please show the command so that all have minimum 3 bins. The command should be something like the below: newbreaks=c(breaks[1], breaks[i:j],breaks[n])
7.3.49 Question Help Given a population in which the probability of success is p=0.35, if a...
 7.3.49 Question Help Given a population in which the probability of success is p=0.35, if a sample of 300 items is taken, then complete parts a and b. a. Calculate the probability the proportion of successes in the sample will be between 0.32 and 0.37. b. Calculate the probability the proportion of successes in the sample will be between 0.32 and 0.37 if the sample size is 100 a. The probability the proportion of successes in the sample will be...
Using R programming language, supply the code for: Generate a random sample of size 10, 000...
Using R programming language, supply the code for: Generate a random sample of size 10, 000 from gamma distribution with scale parameter equal to 1 and shape parameter equal to 2, and form it into a 1000 x 10 matrix. Use the apply() function on this matrix to compute the means of the 1000 rows. Note that the resulting vector comprises the mean of 1000 random samples of size 10 from the above distribution. Examine the distribution of the sample...
I think for Q1: I have to switch 5&2 around. I have no idea about Q2....
 I think for Q1: I have to switch 5&2 around.
I have no idea about Q2.
TIA
A variable whose numerical value is determined by a chance Random variable 1 1 mechanism 4 Sample Statistic 2 Any characteristic that can be measured or categorized 5 Random variable 3. A measure from the population 2 Variable 4 Ameasure from a sample 3 Population 5 Typically arises from sampling Question 4 0/2 points How large does the sample size need to be...
I think for Q1: I have to switch 5&2 around.
I have no idea about Q2.
TIA
A variable whose numerical value is determined by a chance Random variable 1 1 mechanism 4 Sample Statistic 2 Any characteristic that can be measured or categorized 5 Random variable 3. A measure from the population 2 Variable 4 Ameasure from a sample 3 Population 5 Typically arises from sampling Question 4 0/2 points How large does the sample size need to be...
I am supposed to answer these questions using R software. However, I have little to no experience...
 I am supposed to answer these questions using R software.
However, I have little to no experience with R or any other type of
programming. Can someone please help me with the R code for these
questions?
Q1. Suppose you have a population of size 5 [ie. N= corresponding numbers are: You measure sorne quantity (X) and the 21,22,23, 24,25 a) Calculate the population mean () b) Calculate the population variance (ơ2) using the formula ơ2-41 -P Q2. Imagine you...
I am supposed to answer these questions using R software.
However, I have little to no experience with R or any other type of
programming. Can someone please help me with the R code for these
questions?
Q1. Suppose you have a population of size 5 [ie. N= corresponding numbers are: You measure sorne quantity (X) and the 21,22,23, 24,25 a) Calculate the population mean () b) Calculate the population variance (ơ2) using the formula ơ2-41 -P Q2. Imagine you...
A. Suppose you take a sample of size n from a population and calculate a statistic...
 A. Suppose you take a sample of size n from a population and calculate a statistic from that sample. The statistic could be a sample proportion p, a sample mean x, or another statistic. Then suppose we repeat this process over and over again until we find all possible samples of size n from the population (this is a theoretical idea) and we calculate the same statistic from 1. each sample. The collection of all of the statistics calculated is...
 what i currently have is wrong...thanks in advance!
A 95% confidence interval for a population proportion was constructed using a sample proportion from a random sample. Which of the following statements are correct? Select all that apply If we were to use a 90% confidence level, the confidence interval from the same data would produce an interval wider than the 95% confidence interval. There is a 95% chance that the 95% confidence interval actually contains the population proportion. We don't...
what i currently have is wrong...thanks in advance!
A 95% confidence interval for a population proportion was constructed using a sample proportion from a random sample. Which of the following statements are correct? Select all that apply If we were to use a 90% confidence level, the confidence interval from the same data would produce an interval wider than the 95% confidence interval. There is a 95% chance that the 95% confidence interval actually contains the population proportion. We don't...
 Use the given degree of confidence and sample data to construct a confidence interval for the population proportion p. Round to three decimal palces Of 98 adults selected random from one town, 68 have health insurance Find a 90% confidence interval adults in he own who have heal e proportion on r e a ns rance 0585 < p < 0 802 B. 0.617<p<0.770 A. C. 0603 p<0.785 D. 0.574p<0.814
Use the given degree of confidence and sample data to...
Use the given degree of confidence and sample data to construct a confidence interval for the population proportion p. Round to three decimal palces Of 98 adults selected random from one town, 68 have health insurance Find a 90% confidence interval adults in he own who have heal e proportion on r e a ns rance 0585 < p < 0 802 B. 0.617<p<0.770 A. C. 0603 p<0.785 D. 0.574p<0.814
Use the given degree of confidence and sample data to...
 2) Use the given data to find the minimum sample size required to estimate the population proportion. Margin of error: 0.058; confidence level: 90%; and unknown sample proportion p^. 0 201 0223 O 202 0 222 JUL 3 D 31 ER
 7.3.49 Question Help Given a population in which the probability of success is p=0.35, if a sample of 300 items is taken, then complete parts a and b. a. Calculate the probability the proportion of successes in the sample will be between 0.32 and 0.37. b. Calculate the probability the proportion of successes in the sample will be between 0.32 and 0.37 if the sample size is 100 a. The probability the proportion of successes in the sample will be...
 I think for Q1: I have to switch 5&2 around.
I have no idea about Q2.
TIA
A variable whose numerical value is determined by a chance Random variable 1 1 mechanism 4 Sample Statistic 2 Any characteristic that can be measured or categorized 5 Random variable 3. A measure from the population 2 Variable 4 Ameasure from a sample 3 Population 5 Typically arises from sampling Question 4 0/2 points How large does the sample size need to be...
I think for Q1: I have to switch 5&2 around.
I have no idea about Q2.
TIA
A variable whose numerical value is determined by a chance Random variable 1 1 mechanism 4 Sample Statistic 2 Any characteristic that can be measured or categorized 5 Random variable 3. A measure from the population 2 Variable 4 Ameasure from a sample 3 Population 5 Typically arises from sampling Question 4 0/2 points How large does the sample size need to be...
 I am supposed to answer these questions using R software.
However, I have little to no experience with R or any other type of
programming. Can someone please help me with the R code for these
questions?
Q1. Suppose you have a population of size 5 [ie. N= corresponding numbers are: You measure sorne quantity (X) and the 21,22,23, 24,25 a) Calculate the population mean () b) Calculate the population variance (ơ2) using the formula ơ2-41 -P Q2. Imagine you...
I am supposed to answer these questions using R software.
However, I have little to no experience with R or any other type of
programming. Can someone please help me with the R code for these
questions?
Q1. Suppose you have a population of size 5 [ie. N= corresponding numbers are: You measure sorne quantity (X) and the 21,22,23, 24,25 a) Calculate the population mean () b) Calculate the population variance (ơ2) using the formula ơ2-41 -P Q2. Imagine you...
 A. Suppose you take a sample of size n from a population and calculate a statistic from that sample. The statistic could be a sample proportion p, a sample mean x, or another statistic. Then suppose we repeat this process over and over again until we find all possible samples of size n from the population (this is a theoretical idea) and we calculate the same statistic from 1. each sample. The collection of all of the statistics calculated is...
Most questions answered within 3 hours.
-
Where is the error in this code sequence?
String s1 = "Hello";
String s2 = "ello";...
asked 10 months ago -
Financial data for Joel de Paris, Inc., for last year
follow:
Joel de Paris, Inc.
Balance...
asked 10 months ago -
Consider this reaction:
Al2(SO4)3 (aq)+ BaCl3
(aq) Al2Cl6 (aq)- +
3BaSO4(s) . What is the...
asked 10 months ago -
Suppose that Savneet is considering increasing her
recent random sample from 20 car rentals to 40...
asked 10 months ago -
Trucks arrive at an unloading terminal at an average rate of 120
per hour.
Trucks arrive...
asked 10 months ago -
Why are methanol and ethanol completely soluble in water while
octanol is not very little soluble....
asked 10 months ago -
A facilities manager at a university reads in a research report
that the mean amount of...
asked 10 months ago -
When the CuSO4 is rehydrated by adding water to the anhydrous
compound, is this an endothermic...
asked 10 months ago -
A ray of sunlight is passing from diamond into crown glass; the
angle of incidence is...
asked 10 months ago -
A block of mass 0.249 kg is placed on top of a light, vertical
spring of...
asked 10 months ago -
how do the kidneys compensate in the presences of acidosis
a) trigger hyperventilate
b) reserve acid...
asked 10 months ago -
Question 501 pts
The rental rate of capital to the firm increases. Which of the
following...
asked 10 months ago