
Homework Answers
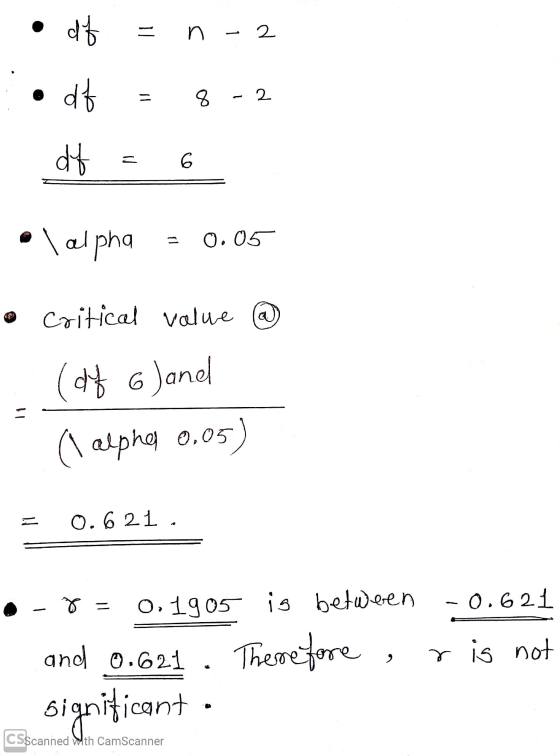
The following data lists the ranked salaries and heights of 8 randomly selected men from a company.Test the claim there is a correlation between salary and height based off this data at a significance level of 0.05.....
=> Solution :-
Given data -


Add Answer to:
5. The following data lists the ranked salaries and heights of 8 randomly selected men from...
Listed below are heights (in inches) and weight (in pounds) of randomly selected adult females subjects...
 Listed below are heights (in inches) and weight (in pounds) of
randomly selected adult females subjects from the California Health
Interview Survey
3) Listed below are heights (in inches) and weight (in pounds) of randomly selected adult female subjects from the California Health Interview Survey. Height 67 64 65 61 68 61 61 65 59 70 59 63 66 64 Weight 140 228 160 130 140 135 118 135 162 201 110 150 215 125 (a) Use a 0.05 significance...
Listed below are heights (in inches) and weight (in pounds) of
randomly selected adult females subjects from the California Health
Interview Survey
3) Listed below are heights (in inches) and weight (in pounds) of randomly selected adult female subjects from the California Health Interview Survey. Height 67 64 65 61 68 61 61 65 59 70 59 63 66 64 Weight 140 228 160 130 140 135 118 135 162 201 110 150 215 125 (a) Use a 0.05 significance...
need help 8) (18 points) A student wonders if tall women tend to date taller men...
 need help
8) (18 points) A student wonders if tall women tend to date taller men than do short women. She randomly selected couples from her school. Here are the data (heights in inches): (remember to do ALL parts) Women Men 62 71 68 67 67 71 69 70 71 68 71 69 a. Do these data provide convincing evidence of a linear relationship between the height of women and men that are dating? Carry out a significance test at...
need help
8) (18 points) A student wonders if tall women tend to date taller men than do short women. She randomly selected couples from her school. Here are the data (heights in inches): (remember to do ALL parts) Women Men 62 71 68 67 67 71 69 70 71 68 71 69 a. Do these data provide convincing evidence of a linear relationship between the height of women and men that are dating? Carry out a significance test at...
#19. The sample heights collected randomly from nine supermodels have the mean of 70.0 in, and...
 #19. The sample heights collected randomly from nine supermodels have the mean of 70.0 in, and the standard deviation of 1.5 in. Another sample set randomly collected from 40 non- supermodels shows the mean of 63.2 in. and the standard deviation of 2.7 in. Assume that we are using 0.05 significance level to test the claim that the mean height of the supermodels is greater than that of non-supermodels. Also assume that two groups of samples are independer and Determine...
The following data show the rankings of 11 states based on expenditure per student (ranked 1...
The following data show the rankings of 11 states based on expenditure per student (ranked 1 highest to 11 lowest) and student-teacher ratio (ranked 1lowest to 11highest). Use Table 1 of Appendix B. State Expenditure per Student Student-Teacher Ratio Arizona 9 11 Colorado 5 8 Florida 5 7 Idaho 2 11 Iowa 7 5 Louisiana 11 4 Massachusetts 1 2 Nebraska 7 2 North Dakota 9 7 South Dakota 11 5 Washington 3 9 a. What is the rank correlation...
1. In a study of red/green color blindness, 750 men and 2700 women are randomly selected...
1. In a study of red/green color blindness, 750 men and 2700 women are randomly selected and tested. Among the men, 66 have red/green color blindness. Among the women, 8 have red/green color blindness. Test the claim that men have a higher rate of red/green color blindness. The test statistic is The p-value is Is there sufficient evidence to support the claim that men have a higher rate of red/green color blindness than women using the 0.01% significance level? A....
1. 2. Do men and women select different breakfasts? The breakfasts ordered by randomly selected men...
 1.
2.
Do men and women select different breakfasts? The breakfasts ordered by randomly selected men and women at a popular breakfast place are shown below. Frequencies of Breakfasts for Men and Women French Toast Pancakes Waffles Omelets Men 86 53 85 83 Women 70 76 110 58 What can be concluded at the a = 0.05 significance level? c. The test-statistic for this data (Please show your answer to three decimal places.) d. The p-value for this sample =...
1.
2.
Do men and women select different breakfasts? The breakfasts ordered by randomly selected men and women at a popular breakfast place are shown below. Frequencies of Breakfasts for Men and Women French Toast Pancakes Waffles Omelets Men 86 53 85 83 Women 70 76 110 58 What can be concluded at the a = 0.05 significance level? c. The test-statistic for this data (Please show your answer to three decimal places.) d. The p-value for this sample =...
The Personnel office of a large company is doing a study to see if there is...
The Personnel office of a large company is doing a study to see if there is any correlation between grade point average in college-level business courses and success on the job. A random sample of 10 employees who had been on the job for one year was selected. Each employee was ranked by his or her supervisor with higher ranks meaning better job performance. Then the transcripts were examined and the employees were ranked by grade poing average in business...
12. Media periodically discuss the issue of heights of winning presidential candidates and heights of their...
 12. Media periodically discuss the issue of heights of winning presidential candidates and heights of their main opponents. The accompanying table lists the heights (cm) from several recent presidential elections. Construct a scatterplot, find the value of the linear correlation coefficient r, and find the P-value of r. Determine whether there is sufficient evidence to support a claim of linear correlation between the two variables. Should we expect that there would be a correlation? Use a significance level of a...
(2 points) In a study of red/ men and 2100 women are randomly selected and tested....
 (2 points) In a study of red/ men and 2100 women are randomly selected and tested. Among the men, 44 have red/green color blindness. Among the women, 5 have red/green color blindness. Test the claim that men have a higher rate of red/green color blindness. (Note: Type P-m not = p-w for the proportions are not equal, p_m > p_w for the proportion of men with color blindness is larger, p_m < p_w ,for the proportion of men is smaller,...
4. Page 452 #5. Among 30,617 randomly selected adults, 5787 consumed herbs within the past 12...
4. Page 452 #5. Among 30,617 randomly selected adults, 5787 consumed herbs within the past 12 months. Use a .01 significance level, to test the claim that fewer than 20% of adults consumed herbs within the past 12 months. 5. Page 441 #27. The Insurance Institute for Highway Safety conducted tests with crashes of new cars traveling at 6 mph. The total cost of the damage was found. Results are listed below for a simple random sample of the tested...
 Listed below are heights (in inches) and weight (in pounds) of
randomly selected adult females subjects from the California Health
Interview Survey
3) Listed below are heights (in inches) and weight (in pounds) of randomly selected adult female subjects from the California Health Interview Survey. Height 67 64 65 61 68 61 61 65 59 70 59 63 66 64 Weight 140 228 160 130 140 135 118 135 162 201 110 150 215 125 (a) Use a 0.05 significance...
Listed below are heights (in inches) and weight (in pounds) of
randomly selected adult females subjects from the California Health
Interview Survey
3) Listed below are heights (in inches) and weight (in pounds) of randomly selected adult female subjects from the California Health Interview Survey. Height 67 64 65 61 68 61 61 65 59 70 59 63 66 64 Weight 140 228 160 130 140 135 118 135 162 201 110 150 215 125 (a) Use a 0.05 significance...
 need help
8) (18 points) A student wonders if tall women tend to date taller men than do short women. She randomly selected couples from her school. Here are the data (heights in inches): (remember to do ALL parts) Women Men 62 71 68 67 67 71 69 70 71 68 71 69 a. Do these data provide convincing evidence of a linear relationship between the height of women and men that are dating? Carry out a significance test at...
need help
8) (18 points) A student wonders if tall women tend to date taller men than do short women. She randomly selected couples from her school. Here are the data (heights in inches): (remember to do ALL parts) Women Men 62 71 68 67 67 71 69 70 71 68 71 69 a. Do these data provide convincing evidence of a linear relationship between the height of women and men that are dating? Carry out a significance test at...
 #19. The sample heights collected randomly from nine supermodels have the mean of 70.0 in, and the standard deviation of 1.5 in. Another sample set randomly collected from 40 non- supermodels shows the mean of 63.2 in. and the standard deviation of 2.7 in. Assume that we are using 0.05 significance level to test the claim that the mean height of the supermodels is greater than that of non-supermodels. Also assume that two groups of samples are independer and Determine...
 1.
2.
Do men and women select different breakfasts? The breakfasts ordered by randomly selected men and women at a popular breakfast place are shown below. Frequencies of Breakfasts for Men and Women French Toast Pancakes Waffles Omelets Men 86 53 85 83 Women 70 76 110 58 What can be concluded at the a = 0.05 significance level? c. The test-statistic for this data (Please show your answer to three decimal places.) d. The p-value for this sample =...
1.
2.
Do men and women select different breakfasts? The breakfasts ordered by randomly selected men and women at a popular breakfast place are shown below. Frequencies of Breakfasts for Men and Women French Toast Pancakes Waffles Omelets Men 86 53 85 83 Women 70 76 110 58 What can be concluded at the a = 0.05 significance level? c. The test-statistic for this data (Please show your answer to three decimal places.) d. The p-value for this sample =...
 12. Media periodically discuss the issue of heights of winning presidential candidates and heights of their main opponents. The accompanying table lists the heights (cm) from several recent presidential elections. Construct a scatterplot, find the value of the linear correlation coefficient r, and find the P-value of r. Determine whether there is sufficient evidence to support a claim of linear correlation between the two variables. Should we expect that there would be a correlation? Use a significance level of a...
 (2 points) In a study of red/ men and 2100 women are randomly selected and tested. Among the men, 44 have red/green color blindness. Among the women, 5 have red/green color blindness. Test the claim that men have a higher rate of red/green color blindness. (Note: Type P-m not = p-w for the proportions are not equal, p_m > p_w for the proportion of men with color blindness is larger, p_m < p_w ,for the proportion of men is smaller,...
Most questions answered within 3 hours.
-
Where is the error in this code sequence?
String s1 = "Hello";
String s2 = "ello";...
asked 10 months ago -
Financial data for Joel de Paris, Inc., for last year
follow:
Joel de Paris, Inc.
Balance...
asked 10 months ago -
Consider this reaction:
Al2(SO4)3 (aq)+ BaCl3
(aq) Al2Cl6 (aq)- +
3BaSO4(s) . What is the...
asked 10 months ago -
Suppose that Savneet is considering increasing her
recent random sample from 20 car rentals to 40...
asked 10 months ago -
Trucks arrive at an unloading terminal at an average rate of 120
per hour.
Trucks arrive...
asked 10 months ago -
Why are methanol and ethanol completely soluble in water while
octanol is not very little soluble....
asked 10 months ago -
A facilities manager at a university reads in a research report
that the mean amount of...
asked 10 months ago -
When the CuSO4 is rehydrated by adding water to the anhydrous
compound, is this an endothermic...
asked 10 months ago -
A ray of sunlight is passing from diamond into crown glass; the
angle of incidence is...
asked 10 months ago -
A block of mass 0.249 kg is placed on top of a light, vertical
spring of...
asked 10 months ago -
how do the kidneys compensate in the presences of acidosis
a) trigger hyperventilate
b) reserve acid...
asked 10 months ago -
Question 501 pts
The rental rate of capital to the firm increases. Which of the
following...
asked 10 months ago