![[5] Q2. Problem 3.14. Refer to Plastic hardness Problem 1.22. Use the data modified for this problem from Datasets for Assign](http://img.homeworklib.com/questions/a39d1ba0-ab3e-11ec-b032-79cf8ec1a926.png?x-oss-process=image/resize,w_560)

Homework Answers
Sol:
Q2).
In order to calculate the F statistic, we need to calculate the regression coefficients and the sum of squares and the sum of products.
For this, we form the table below with squares and cross products.
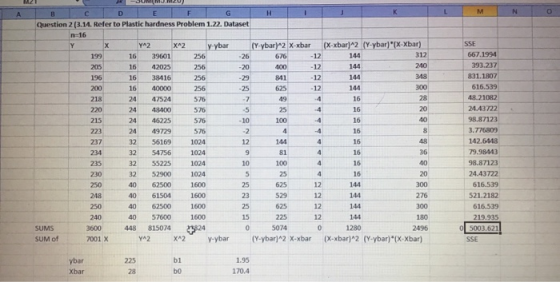
| X | Y | X^2 | Y^2 | X*Y | |
| 16 | 199 | 256 | 39601 | 3184 | |
| 16 | 205 | 256 | 42025 | 3280 | |
| 16 | 196 | 256 | 38416 | 3136 | |
| 16 | 200 | 256 | 40000 | 3200 | |
| 24 | 218 | 576 | 47524 | 5232 | |
| 24 | 220 | 576 | 48400 | 5280 | |
| 24 | 215 | 576 | 46225 | 5160 | |
| 24 | 223 | 576 | 49729 | 5352 | |
| 32 | 237 | 1024 | 56169 | 7584 | |
| 32 | 234 | 1024 | 54756 | 7488 | |
| 32 | 235 | 1024 | 55225 | 7520 | |
| 32 | 230 | 1024 | 52900 | 7360 | |
| 40 | 250 | 1600 | 62500 | 10000 | |
| 40 | 248 | 1600 | 61504 | 9920 | |
| 40 | 250 | 1600 | 62500 | 10000 | |
| 40 | 240 | 1600 | 57600 | 9600 | |
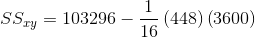
| Total | 448 | 3600 | 13824 | 815074 | 103296 |
We calculate the following quantities:


Now 


Quantities for ANOVA:
Total SS=
SSreg=
SSerror=Totalss-SSreg=5074-4867.2=206.8
The total df=16-1=15
Regression SS=2-1=1
Error df=15-1=14.
The null hypothesis for an F-test:
 ie there no linear relationship between X and Y

We shall form the ANOVA table
| df | SS | MS | F | Significance F | |
| Regression | 1 | 4867.2 | 4867.2 | 329.501 | 3.98E-11 |
| Residual | 14 | 206.8 | 14.77143 | ||
| Total | 15 | 5074 |
Conclusion:
From the table above, we can see that the p-value is 0.0000<0.05, and we reject the null hypothesis. Hence we conclude that there is a linear relationship between X and Y.
(b).
Having equal number observations are always advantageous in that we can estimate the pure error term which helps us to get a more reliable estimate of the error. There are disadvantage that it takes time and efforts as well.
(c).
No, the test in part (a) indicates whether a liner model is a good fit or not. If not, it doesn't give any indication of which model fits the data. If a linear model doesn't fit then one has to procced by transformation, or to a non linear model.
1.22).
(a)
The regression output is:
| r² | 0.973 | n | 16 | |||
| r | 0.986 | k | 1 | |||
| Std. Error | 3.234 | Dep. Var. | Y | |||
| ANOVA table | ||||||
| Source | SS | df | MS | F | p-value | |
| Regression | 5,297.5125 | 1 | 5,297.5125 | 506.51 | 2.16E-12 | |
| Residual | 146.4250 | 14 | 10.4589 | |||
| Total | 5,443.9375 | 15 | ||||
| Regression output | confidence interval | |||||
| variables | coefficients | std. error | t (df=14) | p-value | 95% lower | 95% upper |
| Intercept | 168.6000 | |||||
| X | 2.0344 | 0.0904 | 22.506 | 2.16E-12 | 1.8405 | 2.2283 |
| Predicted values for: Y | ||||||
| 95% Confidence Interval | 95% Prediction Interval | |||||
| X | Predicted | lower | upper | lower | upper | Leverage |
| 40 | 249.975 | 247.073 | 252.877 | 242.456 | 257.494 | 0.175 |
The regression function is:
Hardness in Brinell = 168.6 + 2.0344*Elapsed time
The plot of the data is:

Since the coefficient of determination value is very high, we can say that the regression function appear to give a good fit here.
(b)
The point estimate will be:
Hardness in Brinell = 168.6 + 2.0344*Elapsed time
Elapsed time = 40 hours
Hardness in Brinell = 168.6 + 2.0344*40
Hardness in Brinell = 249.975
(c)
When the elapsed time is increased by 1 hour, then the mean hardness will increase by 2.0344.
If you Satisfy with Answer, Please give me "Thumb Up". It was very important to me.
Add Answer to:
USE THE DATA LISTED IN THE EXCEL BELOW PLEASE
THANK YOU !!
[5] Q2. Problem 3.14....
5. Compute the slope and intercept for the following data: X Y XY X*X Y*Y 2 12 24 4 144 7 20 140 49 400 9 23 207 81 529 1 14 14 1 196 5 15 75 25 225 12 24 288 144 576 36 108 748 304 2070
5. Compute the slope and intercept for the following data: X Y XY X*X Y*Y 2 12 24 4 144 7 20 140 49 400 9 23 207 81 529 1 14 14 1 196 5 15 75 25 225 12 24 288 144 576 36 108 748 304 2070
10 pts The regression equation for the given data points is provided. Graph the regression equation...
 10 pts The regression equation for the given data points is provided. Graph the regression equation and the data points. x 10 14 20 6 6 14 16 24 32 36 y 19 23 29 12 17 23 25 33 37 5 A = 9.3 +0.95% 40 30 20+ 10+ 4 8 12 16 20 24 28 32 36 40 %
Write a C or C++ program A6pc(pp) that accepts one command line argument which is an integer n between 2 and 6 inclusiv...
 Write a C or C++ program
A6pc(pp) that accepts one command
line argument which is an integer n between 2 and 6
inclusive. Generate a string of 60 random upper case English
characters and store them somewhere (e.g. in a char array). Use
pthread to create n threads to convert the string into a
complementary string (‘A’<->’Z’, ‘B’<->’Y’,
‘C’<->’X’, etc). You should divide this conversion task among
the n threads as evenly as possible. Print out the string
both before...
Write a C or C++ program
A6pc(pp) that accepts one command
line argument which is an integer n between 2 and 6
inclusive. Generate a string of 60 random upper case English
characters and store them somewhere (e.g. in a char array). Use
pthread to create n threads to convert the string into a
complementary string (‘A’<->’Z’, ‘B’<->’Y’,
‘C’<->’X’, etc). You should divide this conversion task among
the n threads as evenly as possible. Print out the string
both before...
mework eBook Video Use computer software packages, such as Minitab or Excel, to solve this problem....
 mework eBook Video Use computer software packages, such as Minitab or Excel, to solve this problem. Consider the following data for two variables, and y. 3 22 24 26 30 35 40 y 12 21 33 35 40 36 a. Develop an estimated regression equation for the data of the form ý = bo + ba (to 2 decimals, if necessary). Enter negative value as negative number y = -6.77 + 1.23 2 b. Using the results from part (a),...
Assignment 10 1. A random sample of 37 drivers insured with a company having similar auto...
 Assignment 10 1. A random sample of 37 drivers insured with a company having similar auto insurance policies) was selected The data table lists each of the driver's driving experience in years (DU), and their monthly auto insurance pre- miums in dollars (CU). A researcher wished to determine the following: Correlation: Experience (yrs) 1. On an a priori basis, would the researcher expect a positive or negative inverse) relationship between years driving experience and monthly insurance pre- miums? 4 4...
Consider the following sample data: x 32 23 18 36 13 40 35 24 y 31...
Consider the following sample data: x 32 23 18 36 13 40 35 24 y 31 37 34 60 25 45 43 38 Click here for the Excel Data File b. Calculate b1 and b0. What is the sample regression equation? (Round intermediate calculations to at least 4 decimal places and final answers to 2 decimal places.) yˆy^ + x c. Find the predicted value for y if x equals 11, 16, and 21. (Round intermediate coefficient values and final answers to...
Please use Excel to show the EXCEL FORMULA used to answer these questions. Thank you in...
 Please use Excel to show the EXCEL FORMULA used to answer these
questions. Thank you in advance!
1 0.2 0.3 0.2 0.1 0.1 0.1 1 2 3 4 5 X Probability E(X) Var(x) SD(X) 0.2011 0.276 0.125 0,087 0.075 0.087 0.063 0.04 0.046 12 13 Y 14 Probability 15 E(X) 16 Var(X) 17 SD(X)
Please use Excel to show the EXCEL FORMULA used to answer these
questions. Thank you in advance!
1 0.2 0.3 0.2 0.1 0.1 0.1 1 2 3 4 5 X Probability E(X) Var(x) SD(X) 0.2011 0.276 0.125 0,087 0.075 0.087 0.063 0.04 0.046 12 13 Y 14 Probability 15 E(X) 16 Var(X) 17 SD(X)
please show all the work. if you use excel please show the screenshots. Thank you !...
 please show all the work. if you use excel please show the
screenshots. Thank you !
Question 5 (25pts) Suppose the athletic director at a university would like to develop a regression model to predict the point differential for games played by the men's basketball team. A point differential is the difference between the final points scored by two competing teams. A positive differential is a win, and a negative differential is a loss. For a random sample of games,...
please show all the work. if you use excel please show the
screenshots. Thank you !
Question 5 (25pts) Suppose the athletic director at a university would like to develop a regression model to predict the point differential for games played by the men's basketball team. A point differential is the difference between the final points scored by two competing teams. A positive differential is a win, and a negative differential is a loss. For a random sample of games,...
Please answer all the questions listed below. Thank you! Please answer all the questions listed below....
 Please answer all the questions listed below. Thank you!
Please answer all the
questions listed below. Thank you!
11.1 * Y= a. Y b.-Y c. 0 d. 1 12.0*X= a. X b. -X c. 0 d. 1 13. 0 X IN for X +0 a. X b. -X c. 0 d. 1 e. Doesn't make sense X 14. = 0 a. X b. X c. O d. 1 e. Doesn't make sense 15. X>-X a. True b. False 16. X+1...
Please answer all the questions listed below. Thank you!
Please answer all the
questions listed below. Thank you!
11.1 * Y= a. Y b.-Y c. 0 d. 1 12.0*X= a. X b. -X c. 0 d. 1 13. 0 X IN for X +0 a. X b. -X c. 0 d. 1 e. Doesn't make sense X 14. = 0 a. X b. X c. O d. 1 e. Doesn't make sense 15. X>-X a. True b. False 16. X+1...
please help with #1 a and b. thank you Use the following data for all problems:...
 please help with #1 a and b. thank you
Use the following data for all problems: The data below defines the sea-level concentration of dissolved oxygen for fresh water as a function of temperature: T°C omg/L 0 8 16 14.621 11.843 9.870 24 32 40 8.418 7.305 6.413 a. Approximate o(19) using a 1st order Newton's interpolating polynomial. b. Approximate o(19) using a 2nd order Newton's interpolating polynomial. 2) Use linear algebra to find the coefficients of the 2nd order...
please help with #1 a and b. thank you
Use the following data for all problems: The data below defines the sea-level concentration of dissolved oxygen for fresh water as a function of temperature: T°C omg/L 0 8 16 14.621 11.843 9.870 24 32 40 8.418 7.305 6.413 a. Approximate o(19) using a 1st order Newton's interpolating polynomial. b. Approximate o(19) using a 2nd order Newton's interpolating polynomial. 2) Use linear algebra to find the coefficients of the 2nd order...
 10 pts The regression equation for the given data points is provided. Graph the regression equation and the data points. x 10 14 20 6 6 14 16 24 32 36 y 19 23 29 12 17 23 25 33 37 5 A = 9.3 +0.95% 40 30 20+ 10+ 4 8 12 16 20 24 28 32 36 40 %
 Write a C or C++ program
A6pc(pp) that accepts one command
line argument which is an integer n between 2 and 6
inclusive. Generate a string of 60 random upper case English
characters and store them somewhere (e.g. in a char array). Use
pthread to create n threads to convert the string into a
complementary string (‘A’<->’Z’, ‘B’<->’Y’,
‘C’<->’X’, etc). You should divide this conversion task among
the n threads as evenly as possible. Print out the string
both before...
Write a C or C++ program
A6pc(pp) that accepts one command
line argument which is an integer n between 2 and 6
inclusive. Generate a string of 60 random upper case English
characters and store them somewhere (e.g. in a char array). Use
pthread to create n threads to convert the string into a
complementary string (‘A’<->’Z’, ‘B’<->’Y’,
‘C’<->’X’, etc). You should divide this conversion task among
the n threads as evenly as possible. Print out the string
both before...
 mework eBook Video Use computer software packages, such as Minitab or Excel, to solve this problem. Consider the following data for two variables, and y. 3 22 24 26 30 35 40 y 12 21 33 35 40 36 a. Develop an estimated regression equation for the data of the form ý = bo + ba (to 2 decimals, if necessary). Enter negative value as negative number y = -6.77 + 1.23 2 b. Using the results from part (a),...
 Assignment 10 1. A random sample of 37 drivers insured with a company having similar auto insurance policies) was selected The data table lists each of the driver's driving experience in years (DU), and their monthly auto insurance pre- miums in dollars (CU). A researcher wished to determine the following: Correlation: Experience (yrs) 1. On an a priori basis, would the researcher expect a positive or negative inverse) relationship between years driving experience and monthly insurance pre- miums? 4 4...
 Please use Excel to show the EXCEL FORMULA used to answer these
questions. Thank you in advance!
1 0.2 0.3 0.2 0.1 0.1 0.1 1 2 3 4 5 X Probability E(X) Var(x) SD(X) 0.2011 0.276 0.125 0,087 0.075 0.087 0.063 0.04 0.046 12 13 Y 14 Probability 15 E(X) 16 Var(X) 17 SD(X)
Please use Excel to show the EXCEL FORMULA used to answer these
questions. Thank you in advance!
1 0.2 0.3 0.2 0.1 0.1 0.1 1 2 3 4 5 X Probability E(X) Var(x) SD(X) 0.2011 0.276 0.125 0,087 0.075 0.087 0.063 0.04 0.046 12 13 Y 14 Probability 15 E(X) 16 Var(X) 17 SD(X)
 please show all the work. if you use excel please show the
screenshots. Thank you !
Question 5 (25pts) Suppose the athletic director at a university would like to develop a regression model to predict the point differential for games played by the men's basketball team. A point differential is the difference between the final points scored by two competing teams. A positive differential is a win, and a negative differential is a loss. For a random sample of games,...
please show all the work. if you use excel please show the
screenshots. Thank you !
Question 5 (25pts) Suppose the athletic director at a university would like to develop a regression model to predict the point differential for games played by the men's basketball team. A point differential is the difference between the final points scored by two competing teams. A positive differential is a win, and a negative differential is a loss. For a random sample of games,...
 Please answer all the questions listed below. Thank you!
Please answer all the
questions listed below. Thank you!
11.1 * Y= a. Y b.-Y c. 0 d. 1 12.0*X= a. X b. -X c. 0 d. 1 13. 0 X IN for X +0 a. X b. -X c. 0 d. 1 e. Doesn't make sense X 14. = 0 a. X b. X c. O d. 1 e. Doesn't make sense 15. X>-X a. True b. False 16. X+1...
Please answer all the questions listed below. Thank you!
Please answer all the
questions listed below. Thank you!
11.1 * Y= a. Y b.-Y c. 0 d. 1 12.0*X= a. X b. -X c. 0 d. 1 13. 0 X IN for X +0 a. X b. -X c. 0 d. 1 e. Doesn't make sense X 14. = 0 a. X b. X c. O d. 1 e. Doesn't make sense 15. X>-X a. True b. False 16. X+1...
 please help with #1 a and b. thank you
Use the following data for all problems: The data below defines the sea-level concentration of dissolved oxygen for fresh water as a function of temperature: T°C omg/L 0 8 16 14.621 11.843 9.870 24 32 40 8.418 7.305 6.413 a. Approximate o(19) using a 1st order Newton's interpolating polynomial. b. Approximate o(19) using a 2nd order Newton's interpolating polynomial. 2) Use linear algebra to find the coefficients of the 2nd order...
please help with #1 a and b. thank you
Use the following data for all problems: The data below defines the sea-level concentration of dissolved oxygen for fresh water as a function of temperature: T°C omg/L 0 8 16 14.621 11.843 9.870 24 32 40 8.418 7.305 6.413 a. Approximate o(19) using a 1st order Newton's interpolating polynomial. b. Approximate o(19) using a 2nd order Newton's interpolating polynomial. 2) Use linear algebra to find the coefficients of the 2nd order...
Most questions answered within 3 hours.
-
Where is the error in this code sequence?
String s1 = "Hello";
String s2 = "ello";...
asked 10 months ago -
Financial data for Joel de Paris, Inc., for last year
follow:
Joel de Paris, Inc.
Balance...
asked 10 months ago -
Consider this reaction:
Al2(SO4)3 (aq)+ BaCl3
(aq) Al2Cl6 (aq)- +
3BaSO4(s) . What is the...
asked 10 months ago -
Suppose that Savneet is considering increasing her
recent random sample from 20 car rentals to 40...
asked 10 months ago -
Trucks arrive at an unloading terminal at an average rate of 120
per hour.
Trucks arrive...
asked 10 months ago -
Why are methanol and ethanol completely soluble in water while
octanol is not very little soluble....
asked 10 months ago -
A facilities manager at a university reads in a research report
that the mean amount of...
asked 10 months ago -
When the CuSO4 is rehydrated by adding water to the anhydrous
compound, is this an endothermic...
asked 10 months ago -
A ray of sunlight is passing from diamond into crown glass; the
angle of incidence is...
asked 10 months ago -
A block of mass 0.249 kg is placed on top of a light, vertical
spring of...
asked 10 months ago -
how do the kidneys compensate in the presences of acidosis
a) trigger hyperventilate
b) reserve acid...
asked 10 months ago -
Question 501 pts
The rental rate of capital to the firm increases. Which of the
following...
asked 10 months ago