
Homework Answers
a) Degree of freedom = 
putting the values and rounding up to the next integer

b) confidence interval for the difference between two mean is

for 95% confidence and df= 61


c) 
Add Answer to:
g results for two samples randomly taken from two populations with unequal (9%) Consider the followin...
Consider the following hypothesis test. The following results are from independent samples taken from two populations....
Consider the following hypothesis test. The following results are from independent samples taken from two populations. H0: Ha: μ1 μ2 0 μ1 μ2 0 Sample 1 Sample 2 n1 35 n2 40 13.6 10.1 s1 5.2 s2 8.5 testSELF x ¯1 x ¯2 x ¯1 x ¯ a. What is the value of the test statistic? b. What is the degrees of freedom for the t distribution? c. What is the p-value? d. At α .05, what is your conclusion?
(2 pts) Consider the test of the claims that the two samples described below come from...
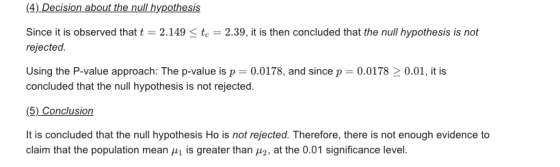
 (2 pts) Consider the test of the claims that the two samples described below come from two populations whose means are equal vs. the alternative that the population means are different. Assume that the samples are independent simple random samples and that both populations are approximately normal with equal variances. Use a significance level of α-0.01 Sample 1: ni - 17, x1- 21, s1 10 Sample 2: n2 -4, x2-29, s2 -5 (a) Degrees of freedom - (b) The test...
Consider the following hypothesis test. Ho:μ1-μ2=0 Hα:μ1-μ2 #0 The following results are from independent samples taken...
Consider the following hypothesis test. Ho:μ1-μ2=0 Hα:μ1-μ2 #0 The following results are from independent samples taken from two populations sample1 sample 2 n1-35 n2=40 x1=13.6 x2=10.1 s1=5.2 s2=8.5 a.What is the value of the test statistic? b.What is the value of the degrees of freedom for the distribution? c.What is the p-value? d.At α=.05, what is your conclusion?
Two random samples are selected from two independent populations. A summary of the samples sizes, sample...
Two random samples are selected from two independent populations. A summary of the samples sizes, sample means, and sample standard deviations is given below: n1= 37 n2=44 x-bar1= 58.6 x-bar2= 73.8 s1=5.4 s2=10.6 Find a 97% confidence interval for the difference μ1−μ2μ1−μ2 of the means, assuming equal population variances.
Consider the following results for two samples randomly taken from two normal populations with equal variances....
Consider the following results for two samples randomly taken from two normal populations with equal variances. Sample I Sample II Sample Size 28 35 Sample Mean 48 44 Population Standard Deviation 9 10 a. Develop a 95% confidence interval for the difference between the two population means. b. Is there conclusive evidence that one population has a larger mean? Explain.
Two random samples are selected from two independent populations. A summary of the samples sizes, sample...
Two random samples are selected from two independent populations. A summary of the samples sizes, sample means, and sample standard deviations is given below: n1=51, n2=46, x¯1=57.8, x¯2=75.3, s1=5.2 s2=11 Find a 94.5% confidence interval for the difference μ1−μ2μ1−μ2 of the means, assuming equal population variances. Confidence Interval =
Two random samples are selected from two independent populations. A summary of the samples sizes, sample...
Two random samples are selected from two independent populations. A summary of the samples sizes, sample means, and sample standard deviations is given below: n1=39, x¯1=57, s1=5.8 n2=50, x¯2=74.2 ,s2=10 Find a 98% confidence interval for the difference μ1−μ2 of the means, assuming equal population variances. Confidence Interval =
#3. 2 Consider the following results for two samples randomly taken from two populations. AWN Sample...
 #3. 2 Consider the following results for two samples randomly taken from two populations. AWN Sample Size Sample Mean 7 Sample Standard Deviation Sample A Sample B 20 25 28 22 9 a. Determine the degrees of freedom for the t distribution. 10 b. At 95% confidence, what is the margin of error? 11 c. Develop a 95% confidence interval for the difference between the two population means.
Consider the following data from two independent populations (with unequal variances). Sample Standard Deviation Sample Size...
Consider the following data from two independent populations (with unequal variances). Sample Standard Deviation Sample Size Sample #1 18 10 Sample #2 12 12 If an independent samples t-test is to be conducted, the appropriate degrees of freedom to use is? *****Answer is not 20****
1. 036 points value: Consider the following data from two independent populations (with unequal variances). Sample...
 1. 036 points value: Consider the following data from two independent populations (with unequal variances). Sample #1 Sample #2 Sample Standard Deviation 18 12 Sample Size 10 12 If an independent samples t-test is to be conducted, the appropriate degrees of freedom to use is
 (2 pts) Consider the test of the claims that the two samples described below come from two populations whose means are equal vs. the alternative that the population means are different. Assume that the samples are independent simple random samples and that both populations are approximately normal with equal variances. Use a significance level of α-0.01 Sample 1: ni - 17, x1- 21, s1 10 Sample 2: n2 -4, x2-29, s2 -5 (a) Degrees of freedom - (b) The test...
 #3. 2 Consider the following results for two samples randomly taken from two populations. AWN Sample Size Sample Mean 7 Sample Standard Deviation Sample A Sample B 20 25 28 22 9 a. Determine the degrees of freedom for the t distribution. 10 b. At 95% confidence, what is the margin of error? 11 c. Develop a 95% confidence interval for the difference between the two population means.
 1. 036 points value: Consider the following data from two independent populations (with unequal variances). Sample #1 Sample #2 Sample Standard Deviation 18 12 Sample Size 10 12 If an independent samples t-test is to be conducted, the appropriate degrees of freedom to use is
Most questions answered within 3 hours.
-
Where is the error in this code sequence?
String s1 = "Hello";
String s2 = "ello";...
asked 10 months ago -
Financial data for Joel de Paris, Inc., for last year
follow:
Joel de Paris, Inc.
Balance...
asked 10 months ago -
Consider this reaction:
Al2(SO4)3 (aq)+ BaCl3
(aq) Al2Cl6 (aq)- +
3BaSO4(s) . What is the...
asked 10 months ago -
Suppose that Savneet is considering increasing her
recent random sample from 20 car rentals to 40...
asked 10 months ago -
Trucks arrive at an unloading terminal at an average rate of 120
per hour.
Trucks arrive...
asked 10 months ago -
Why are methanol and ethanol completely soluble in water while
octanol is not very little soluble....
asked 10 months ago -
A facilities manager at a university reads in a research report
that the mean amount of...
asked 10 months ago -
When the CuSO4 is rehydrated by adding water to the anhydrous
compound, is this an endothermic...
asked 10 months ago -
A ray of sunlight is passing from diamond into crown glass; the
angle of incidence is...
asked 10 months ago -
A block of mass 0.249 kg is placed on top of a light, vertical
spring of...
asked 10 months ago -
how do the kidneys compensate in the presences of acidosis
a) trigger hyperventilate
b) reserve acid...
asked 10 months ago -
Question 501 pts
The rental rate of capital to the firm increases. Which of the
following...
asked 10 months ago