Is there a relationship between total team salary and team performance in a sport such as...
Is there a relationship between total team salary and team
performance in a sport such as professional basketball? To answer
this question we will examine the number of wins and total team
payroll in a recent season for all the teams in the National
Basketball Association (NBA). The data are in this Excel
file.
Question 1. Let the x-variable be the team payroll and let the y-variable be the team wins. Find the intercept b0 and slope b1 of the least squares prediction line = b0 + b1*Payroll.
intercept (use 2 decimal places in your
answer)
slope (use 3 decimal places in your answer)
Question 2. If an NBA team spent an additional $9.2 million in team salary, how many more games could the team expect to win? (Use 1 decimal place in your answer).
Question 3. Suppose a basketball team spent
$111 million on salaries and won 46 games.
Part a. Based on their payroll would they have
done better or worse than predicted? (only 1 submission
allowed).
Worse than predictedBetter than predicted
Part b. What is the residual for this basketball
team? (use 2 decimal places in your answer)
Question 4. All teams have a goal to make the postseason playoffs. A basketball team thinks that it can make the playoffs next year if it wins 12 more games. How much should the basketball team increase its payroll if it wants to make the playoffs next year?
Note: Use 2 decimal places. Your answer should
be in units of $1 million; do NOT include a dollar sign in the
answer; for example, if a team should increase its payroll by
$5,250,000, then the answer is 5.25.
$
increase in team payroll (in $million) needed for basketball team to win 12 more games
| Recent BASKETBALL Team Payrolls and Wins | ||
| Team | Payroll | Wins |
| Cleveland Cavaliers | 137.363 | 50 |
| Los Angeles Lakers | 105.355 | 35 |
| Boston Celtics | 115.084 | 55 |
| Orlando Magic | 98.285 | 25 |
| Denver Nuggets | 107.889 | 46 |
| Portland Trail Blazers | 119.109 | 49 |
| Houston Rockets | 119.070 | 65 |
| San Antonio Spurs | 116.154 | 47 |
| Dallas Mavericks | 85.904 | 24 |
| New Orleans Pelicans | 119.800 | 48 |
| Utah Jazz | 107.613 | 48 |
| Atlanta Hawks | 100.414 | 24 |
| Phoenix Suns | 94.818 | 21 |
| Miami Heat | 131.223 | 44 |
| Chicago Bulls | 89.425 | 27 |
| Philadelphia 76ers | 100.794 | 52 |
| Detroit Pistons | 100.086 | 39 |
| Indiana Pacers | 94.430 | 48 |
| Charlotte Hornets | 117.228 | 36 |
| Milwaukee Bucks | 120.805 | 44 |
| Brooklyn Nets | 96.040 | 28 |
| Toronto Raptors | 116.575 | 59 |
| New York Knicks | 107.855 | 29 |
| Golden State Warriors | 137.495 | 58 |
| Minnesota Timberwolves | 117.469 | 47 |
| Memphis Grizzlies | 110.273 | 22 |
| Oklahoma City Thunder | 134.294 | 48 |
| Washington Wizards | 124.180 | 43 |
| Los Angeles Clippers | 118.907 | 42 |
| Sacramento Kings | 95.628 | 27 |
Homework Answers
Answer to 1st question :

where x = team payroll and y is the team wins and also a = y - intercept = b0
The excel output of the following data is given below -

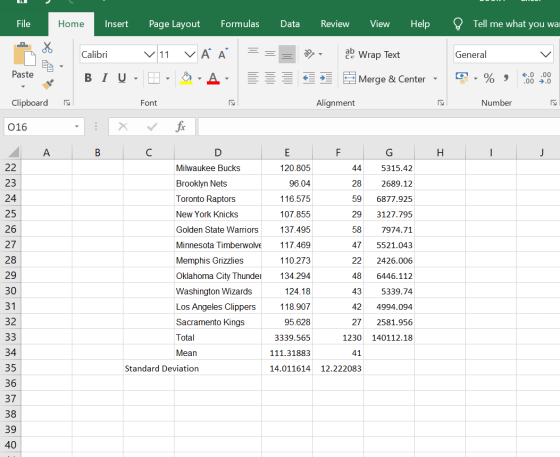
So, Mean of x ,  = 111.32 and Mean of y ,
  = 41
= 41
Standard deviation of x , S.D. (x) = 14.02 , and , Standard Deviation of y , S.D. (y) = 12.22
Number of Observations , n = 30

b1 = 0.541 = slope and b0 = y - intercept = -19.22
The equation is -
 = -19.22 + 0.541x
Answer to 2nd question :
Given , x = $ 9.2 + $ 137.363 = $146.563 (The NBA team is Cleveland
Cavaliers)
= -19.22 + (0.541 x 146.653) = 60.1 wins approximately
Originally they had 50 wins , So , the team could expect to win 10.1 extra games
Answer to 3rd question :
Given , x = $111
= -19.22 + (0.541 x 111) = 40.83
They had fared better than predicted...... (Answer a)
Originally the had won 46 games
The residual = Original - predicted = 46 - 40.83 = 5.17 (Answer b)
Answer to 4th question :
Let that basket ball team be Cleveland Cavaliers
They have originally 50 wins , If additional 12 wins are added to their tally their total wins would be 62
So , substituting these values in the prediction equation we solve for x ,
we get the value of x = $150.13
Increase in team payroll (in $million) needed for basketball team to win 12 more games = $150.13 - $137.363
= $12.77
(NOTE THAT : In Answers 2 & 4 I just took an example from the data , for other values the answer can be different)
Add Answer to:
Is there a relationship between total team salary and team
performance in a sport such as...
All teams have a goal to make the postseason playoffs. A basketball team thinks that it...
 All teams have a goal to make the postseason playoffs. A
basketball team thinks that it can make the playoffs next year if
it wins 10 more games. How much should the basketball team increase
its payroll if it wants to make the playoffs next year?
Note: Use 2 decimal places. Your answer should
be in units of $1 million; do NOT include a dollar sign in the
answer; for example, if a team should increase its payroll by
$5,250,000,...
All teams have a goal to make the postseason playoffs. A
basketball team thinks that it can make the playoffs next year if
it wins 10 more games. How much should the basketball team increase
its payroll if it wants to make the playoffs next year?
Note: Use 2 decimal places. Your answer should
be in units of $1 million; do NOT include a dollar sign in the
answer; for example, if a team should increase its payroll by
$5,250,000,...
Fundameintals of Quant p between total team salary and the performance of teams in the N...
 Fundameintals of Quant p between total team salary and the performance of teams in the N l6 r NFL) Foe the 2006 season, a lincar model predicting Wins (out of She )hom the total tean Salary (in miltions of USD) for the 32 teans in the lengue night yoa c) What is the probability that no one makes a parcbase in the net 2 id Wins1.783+0.062 x Salary s made wins bWhatdoes the lope mean in this context? e) Ifone...
Question 2 (26 points) In an NBA (National Basketball Association) series, the team that wins four...
 Question 2 (26 points) In an NBA (National Basketball Association) series, the team that wins four games out of seven is the winner and it will win the big prize. Suppose that teams A and B face each other in the games and that team A has probability 0.4 of winning a game over team B. a) (13 points) Compute the probability that team A wins the big prize at (just after) the 6"game. b) (13 points) Compute the probability...
3. The relationship between the number of games won by a minor league team and the...
3. The relationship between the number of games won by a minor league team and the number of people attending their home games is analyzed. A regression analysis to predict the attendance from the number of games won gives the model yˆ = −2200 +178x where x is the number of wins and y is the number of people attending. a) State the value of the slope of the regression line:_________. Interpret the slope with regards to the story problem...
In sports betting, sports books establish winning margins for a team that is favored to win...
 In sports betting, sports books establish winning margins for a team that is favored to win a game. team bet upon wins after accounting for this spread. For example, if Team A is favored by 5 points, bet. However, if Team A wins the game by only 3 points, then a bet on Team Ais a losing bet. Supp relative to the spread is approximately normally distributed with a mean of -1.0 point and a standa (a) What is the...
The National Football League (NFL) records a variety of performance data for individuals and team...
 The National Football League (NFL) records a variety of performance data for individuals and teams. To investigate the importance of passing on the percentage of games won by a team, the following data show the conference (Conf), average number of passing yards per attempt (Yds/Att), the number of interceptions thrown per attempt (Int/Att), and the percentage of games won (Win96) for a random sample of 16 NFL teams for a season Conf NFC NFC NFC AFC NFC NFC AFC AFC...
The National Football League (NFL) records a variety of performance data for Individuals and team...
 The National Football League (NFL) records a variety of performance data for Individuals and teams. To investigate the importance of passing on the percentage of games won by a team, the following data show the average number of passing yards per attempt (Yds/Att) and the percentage of games won (Win96) for a random sample of 10 NFL teams. Team Team 1 Team 2 Team 3 Team 4 Team 5 Team б Team 7 Team 8 Team 9 Team 10 Yds/Att...
Study Prep, Chapter 13: Correlation, Simple Linear Regression, Multiple Regression MULTIPLE REGRESSION Major League Baseball Team (Team) recently hired Trixie, a third year student in the Fowler Co...
 Study Prep, Chapter 13: Correlation, Simple Linear Regression, Multiple Regression MULTIPLE REGRESSION Major League Baseball Team (Team) recently hired Trixie, a third year student in the Fowler College of Business, for an internship position. After showing Trixie around the facilities, Team provided Trixie with an office, desk, computer, phone, and instructed her to "figure out what professional baseball teams need to do to get fans in the seats." Below is a regression model Trixie developed in trying to get a...
The National Football League (NFL) records a variety of performance data for individuals and team...
 The National Football League (NFL) records a variety of performance data for individuals and teams. To investigate the importance of passing on the percentage of games won by a team, the data in the Excel Online file below show the conference (Conf), average number of passing yards per attempt (Yds/Att), the number of interceptions thrown per attempt (Int/Att), and the percentage of games won (Win96) for a random sample of 16 NFL teams for a season. Construct a spreadsheet to...
The National Football League (NFL) records a variety of performance data for individuals and teams. To investigate the importance of passing on the percentage of games won by a team, the following d...
 The National Football League (NFL) records a variety of performance data for individuals and teams. To investigate the importance of passing on the percentage of games won by a team, the following data show the conference (Conf), average number of passing yards per attempt (Yds/Att), the number of interceptions thrown per attempt (Int/Att), and the percentage of games won (win96) for a random sample of 16 NFL teams for a season Conf NFC NFC NFC AFC NFC NFC AFC AFC...
 All teams have a goal to make the postseason playoffs. A
basketball team thinks that it can make the playoffs next year if
it wins 10 more games. How much should the basketball team increase
its payroll if it wants to make the playoffs next year?
Note: Use 2 decimal places. Your answer should
be in units of $1 million; do NOT include a dollar sign in the
answer; for example, if a team should increase its payroll by
$5,250,000,...
All teams have a goal to make the postseason playoffs. A
basketball team thinks that it can make the playoffs next year if
it wins 10 more games. How much should the basketball team increase
its payroll if it wants to make the playoffs next year?
Note: Use 2 decimal places. Your answer should
be in units of $1 million; do NOT include a dollar sign in the
answer; for example, if a team should increase its payroll by
$5,250,000,...
 Fundameintals of Quant p between total team salary and the performance of teams in the N l6 r NFL) Foe the 2006 season, a lincar model predicting Wins (out of She )hom the total tean Salary (in miltions of USD) for the 32 teans in the lengue night yoa c) What is the probability that no one makes a parcbase in the net 2 id Wins1.783+0.062 x Salary s made wins bWhatdoes the lope mean in this context? e) Ifone...
 Question 2 (26 points) In an NBA (National Basketball Association) series, the team that wins four games out of seven is the winner and it will win the big prize. Suppose that teams A and B face each other in the games and that team A has probability 0.4 of winning a game over team B. a) (13 points) Compute the probability that team A wins the big prize at (just after) the 6"game. b) (13 points) Compute the probability...
 In sports betting, sports books establish winning margins for a team that is favored to win a game. team bet upon wins after accounting for this spread. For example, if Team A is favored by 5 points, bet. However, if Team A wins the game by only 3 points, then a bet on Team Ais a losing bet. Supp relative to the spread is approximately normally distributed with a mean of -1.0 point and a standa (a) What is the...
 The National Football League (NFL) records a variety of performance data for individuals and teams. To investigate the importance of passing on the percentage of games won by a team, the following data show the conference (Conf), average number of passing yards per attempt (Yds/Att), the number of interceptions thrown per attempt (Int/Att), and the percentage of games won (Win96) for a random sample of 16 NFL teams for a season Conf NFC NFC NFC AFC NFC NFC AFC AFC...
 The National Football League (NFL) records a variety of performance data for Individuals and teams. To investigate the importance of passing on the percentage of games won by a team, the following data show the average number of passing yards per attempt (Yds/Att) and the percentage of games won (Win96) for a random sample of 10 NFL teams. Team Team 1 Team 2 Team 3 Team 4 Team 5 Team б Team 7 Team 8 Team 9 Team 10 Yds/Att...
 Study Prep, Chapter 13: Correlation, Simple Linear Regression, Multiple Regression MULTIPLE REGRESSION Major League Baseball Team (Team) recently hired Trixie, a third year student in the Fowler College of Business, for an internship position. After showing Trixie around the facilities, Team provided Trixie with an office, desk, computer, phone, and instructed her to "figure out what professional baseball teams need to do to get fans in the seats." Below is a regression model Trixie developed in trying to get a...
 The National Football League (NFL) records a variety of performance data for individuals and teams. To investigate the importance of passing on the percentage of games won by a team, the data in the Excel Online file below show the conference (Conf), average number of passing yards per attempt (Yds/Att), the number of interceptions thrown per attempt (Int/Att), and the percentage of games won (Win96) for a random sample of 16 NFL teams for a season. Construct a spreadsheet to...
 The National Football League (NFL) records a variety of performance data for individuals and teams. To investigate the importance of passing on the percentage of games won by a team, the following data show the conference (Conf), average number of passing yards per attempt (Yds/Att), the number of interceptions thrown per attempt (Int/Att), and the percentage of games won (win96) for a random sample of 16 NFL teams for a season Conf NFC NFC NFC AFC NFC NFC AFC AFC...
Most questions answered within 3 hours.
-
Where is the error in this code sequence?
String s1 = "Hello";
String s2 = "ello";...
asked 10 months ago -
Financial data for Joel de Paris, Inc., for last year
follow:
Joel de Paris, Inc.
Balance...
asked 10 months ago -
Consider this reaction:
Al2(SO4)3 (aq)+ BaCl3
(aq) Al2Cl6 (aq)- +
3BaSO4(s) . What is the...
asked 10 months ago -
Suppose that Savneet is considering increasing her
recent random sample from 20 car rentals to 40...
asked 10 months ago -
Trucks arrive at an unloading terminal at an average rate of 120
per hour.
Trucks arrive...
asked 10 months ago -
Why are methanol and ethanol completely soluble in water while
octanol is not very little soluble....
asked 10 months ago -
A facilities manager at a university reads in a research report
that the mean amount of...
asked 10 months ago -
When the CuSO4 is rehydrated by adding water to the anhydrous
compound, is this an endothermic...
asked 10 months ago -
A ray of sunlight is passing from diamond into crown glass; the
angle of incidence is...
asked 10 months ago -
A block of mass 0.249 kg is placed on top of a light, vertical
spring of...
asked 10 months ago -
how do the kidneys compensate in the presences of acidosis
a) trigger hyperventilate
b) reserve acid...
asked 10 months ago -
Question 501 pts
The rental rate of capital to the firm increases. Which of the
following...
asked 10 months ago