Suppose we wish to generate a sample from the exponential (β) distribution, and only have access...
Suppose we wish to generate a sample from the exponential (β) distribution, and only have access to a computer which generates numbers from the skew logistic distribution. It turns out that if X~SkewLogistic (β), then log(1+exp(-X)) is exponential (β). Show that this is true and check by simulation that this transformation is correct.
Homework Answers
The CDF of Skewed logistic distribution is given by .
F(x) = ( 1 + e-x)-
Let F(x) = y
y = ( 1 + e-x)-
= 1 / ( 1 + e-x)
( 1 + e-x)
= 1 / y
( 1 + e-x) = ( 1 / y )(1/)
e-x = ( 1 / y )(1/)
-1
Talking log both side
-x = log( ( 1 / y )(1/)
- 1 )
x = - log( ( 1 / y )(1/)
- 1
)
......( 1 ) Skewed logistic distribution
Here y ~ U ( 0 , 1 )
So we will generate random samples for y from Uniform ( 0,1 )
for for some fixed values of 
Its transformation i.e X ~ Skew Logistic (β) , then log(1+exp(-X))
Here
x = - log( ( 1 / y )(1/)
- 1 )
Transforming variable to log(1+exp(-X))
exp( -x ) = ( 1 / y )(1/)
- 1
1 + exp( -x ) = ( 1 / y )(1/)
log( 1 + exp( -x ) ) = log ( ( 1 / y )(1/)
)
Now CDF of Exponential distribution is given by
F(x) = 1 - e - ( x)
x)
Let y = F(x)
y = 1 - e - (
x)
e - (
x) = 1 - y
Talking log both side
-
x = log( 1-y )
x = - log ( 1- y ) /
......( 2 ) for exponential distribution
Here y ~ U ( 0 , 1 )
{ Note -To generate random variable we can use statistical table or any software like R , Mini-tab etc
Here I am using R software to generate random variable }
We will generate Random sample from U ( 0 , 1 ) , so that we will get Random samples for Skewed logistic distribution by given in eq (1) and then for exponential distribution by given in eq (2)
R - code
# for Skewed logistic distribution
# let us fix
= 2
>y=runif(100,0,1)
# will generate 100 Random sample from U ( 0 , 1 )
>b=2
# b =
, fix
= 2
# Now " x1 " will generate
simulated Random samples for Skewed logistic
distribution
>x1 = - log( ( 1 / y )^(1/b) - 1)
# " TX " is transformation used
>TX=log(1+exp(-x1)) # given transformation for Skewed logistic
( Note- Histogram and density curve for transformed variable )
> hist(TX, prob=TRUE,main="Transformed Variable ") # to
generate histogram for
= 2
>
lines(density(TX),col=10)
# to dram density curves

Thus we can see that transformed variable look like exponential distribution .
Run similar program for b =
= 5 and draw histogram and curve for it
> hist(TX, prob=TRUE,main="Transformed Variable ") # to
generate histogram for
= 5
>
lines(density(TX),col=10)
# to dram density curves

Thus we can see that transformed variable look like exponential distribution .
Now we will draw random sample for exponential distribution
Note - In R we can use direct command " rexp ( n , b ) " to draw
random samples from exponential distribution, where n is sample
size { for this case n =100 } and b =
is parameter value { this case
= 2 , 5 }
But we will use eqn ( 2 ) to generate random sample
>y=runif(100,0,1)
)
# will generate 100 Random sample from U ( 0 , 1 )
>b=2
# b =
, fix
= 2
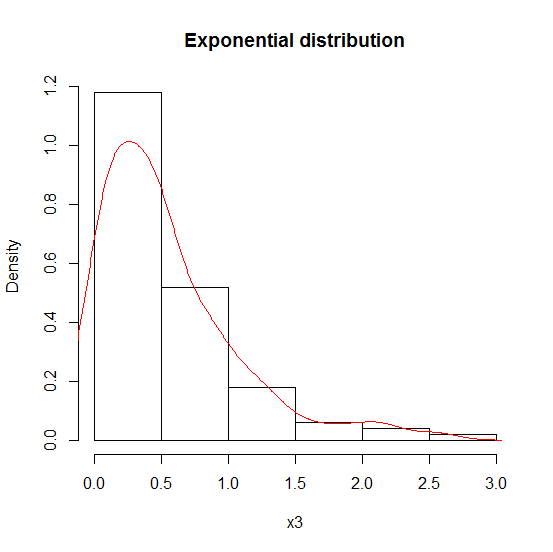
# Now " x3 " will generate Random samples from exponential distribution
>x3=-log(1-y)/b
( Note- Histogram and density curve for generated random
variables )
>hist(x3, prob=TRUE,,main="Exponential
distribution")
# to generate histogram for
= 2
>lines(density(x3),,col=10) # to dram density
curves
Run similar program for b =
= 5 and draw histogram and curve for it
> hist(x3, prob=TRUE,main="Exponential distribution") # to
generate histogram for
= 5
>
lines(density(x3),col=10)
# to dram density curves

Hence we can see If if X~SkewLogistic (β), then log(1+exp(-X)) is exponential (β).
{ In R code ; x1 represents simulated random variables from SkewLogistic (β),
transformation log(1+exp(-X)) is stored in variable TX and exponential (β). is stored in variable x3 }
Add Answer to:
Suppose we wish to generate a sample from the exponential (β)
distribution, and only have access...
Suppose that we wish to generate observations from the discrete distribution 3 a) Suppose that we...
 Suppose that we wish to generate observations from the discrete
distribution
3 a) Suppose that we wish to generate observations from the discrete distribution with probability mass function 2)+1 20 x=1,2, 3, 4, 5 Clearly describe the algorithm to do this and give the random numbers corresponding to the following uniform(0,1) sample. 0.5197 0.1790 0.9994 0.6873 0.7294 0.5791 0.0361 0.2581 0.0026 0.8213 NB: Do not use R for this part of the question. two numbers rolled. Write an R function...
Suppose that we wish to generate observations from the discrete
distribution
3 a) Suppose that we wish to generate observations from the discrete distribution with probability mass function 2)+1 20 x=1,2, 3, 4, 5 Clearly describe the algorithm to do this and give the random numbers corresponding to the following uniform(0,1) sample. 0.5197 0.1790 0.9994 0.6873 0.7294 0.5791 0.0361 0.2581 0.0026 0.8213 NB: Do not use R for this part of the question. two numbers rolled. Write an R function...
3 a) Suppose that we wish to generate observations from the discrete distribution with probability mass...
 3 a) Suppose that we wish to generate observations from the discrete distribution with probability mass function 2)+1 20 x=1,2, 3, 4, 5 Clearly describe the algorithm to do this and give the random numbers corresponding to the following uniform(0,1) sample. 0.5197 0.1790 0.9994 0.6873 0.7294 0.5791 0.0361 0.2581 0.0026 0.8213 NB: Do not use R for this part of the question. two numbers rolled. Write an R function which will generate n random rolls of a pair b) Consider...
Suppose is a random sample from exponential distribution having unknown mean . We wish to test vs. . Consider the following tests: Test 1: Reject if and only if ; Test 2: Reject if and only if...
Suppose is a random sample from exponential distribution having unknown mean . We wish to test vs. . Consider the following tests: Test 1: Reject if and only if ; Test 2: Reject if and only if Find the power of each test at . We were unable to transcribe this imageWe were unable to transcribe this imageHo : θ = 4 We were unable to transcribe this imageWe were unable to transcribe this imageWe were unable to transcribe this...
7. Suppose X1, X2, ..., Xn is a random sample from an exponential distribution with parameter...
 7. Suppose X1, X2, ..., Xn is a random sample from an exponential distribution with parameter K. (Remember f(x;2) = 2e-Ax is the pdf for the exponential dist”.) a) Find the likelihood function, L(X1, X2, ..., Xn). b) Find the log-likelihood function, b = log L. c) Find dl/d, set the result = 0 and solve for 2.
7. (15 pts) Suppose X1, X2, ..., X, is a random sample from an exponential distribution...
 7. (15 pts) Suppose X1, X2, ..., X, is a random sample from an exponential distribution with parameter 2. (Remember f(x;2) = ne-^x is the pdf for the exponential dista.) a) Find the likelihood function, L(X1, X2, Xn). b) Find the log-likelihood function, I = log L. c) Find d //d, set the result = 0 and solve for 2.
Q: Help in understanding and solving this example from Data Structure & Algorithms (Computer Science) with...
Q: Help in understanding and solving this example from Data Structure & Algorithms (Computer Science) with the steps of the solution to better understand, thanks. **Using R studio language, thanks. R Lab: You need to use R commands and using R markdown to generate a report that interacted with statistics R. A sample program is provided. x =0:20 theta<-3 pdff<- (1/theta)*exp(-x/theta) cdff<- 1-exp(-x/theta) plot(x, pdff, type ='l') Instructions: 1. Use R command to generate a sample of random numbers from...
4. (Part 1)Suppose a random sample of size n is drawn from Unif(0, θ). We wish...
4. (Part 1)Suppose a random sample of size n is drawn from Unif(0, θ). We wish to test H0: θ = 3 vs. H1: θ > 3 using the critical region Xmax > c. If the test has α = 0.05 and β = 0.12681 when θ = 4, find the values of c and n that make this happen. (Part2) Write a simulation that checks your answer from question 4.
4. In Uganda only 9% of the population has access to electricity. Suppose we randomly sample...
 4. In Uganda only 9% of the population has access to electricity. Suppose we randomly sample 20 people in Uganda. Let X be the number of people in our sample who have access to electricity. (a) What distribution will X have? (Hint: X only takes on the values 0, 1, ... 19, 20, so it can't be a continuous distribution.) (b) Find the mean and standard deviation for X. (c) Find the probability that 10 people or less in the...
In Uganda only 9% of the population has access to electricity. Suppose we randomly sample 20...
In Uganda only 9% of the population has access to electricity. Suppose we randomly sample 20 people in Uganda. Let X be the number of people in our sample who have access to electricity. (a) What distribution will X have? (Hint: X only takes on the values 0, 1, ... 19, 20, so it can’t be a continuous distribution.) (b) Find the mean and standard deviation for X . ( c) Find the probability that 10 people or less in...
Using R, Exercise 4 (CLT Simulation) For this exercise we will simulate from the exponential distribution....
 Using R,
Exercise 4 (CLT Simulation) For this exercise we will simulate from the exponential distribution. If a random variable X has an exponential distribution with rate parameter A, the pdf of X can be written for z 2 0 Also recall, (a) This exercise relies heavily on generating random observations. To make this reproducible we will set a seed for the randomization. Alter the following code to make birthday store your birthday in the format yyyymmdd. For example, William...
Using R,
Exercise 4 (CLT Simulation) For this exercise we will simulate from the exponential distribution. If a random variable X has an exponential distribution with rate parameter A, the pdf of X can be written for z 2 0 Also recall, (a) This exercise relies heavily on generating random observations. To make this reproducible we will set a seed for the randomization. Alter the following code to make birthday store your birthday in the format yyyymmdd. For example, William...
 Suppose that we wish to generate observations from the discrete
distribution
3 a) Suppose that we wish to generate observations from the discrete distribution with probability mass function 2)+1 20 x=1,2, 3, 4, 5 Clearly describe the algorithm to do this and give the random numbers corresponding to the following uniform(0,1) sample. 0.5197 0.1790 0.9994 0.6873 0.7294 0.5791 0.0361 0.2581 0.0026 0.8213 NB: Do not use R for this part of the question. two numbers rolled. Write an R function...
Suppose that we wish to generate observations from the discrete
distribution
3 a) Suppose that we wish to generate observations from the discrete distribution with probability mass function 2)+1 20 x=1,2, 3, 4, 5 Clearly describe the algorithm to do this and give the random numbers corresponding to the following uniform(0,1) sample. 0.5197 0.1790 0.9994 0.6873 0.7294 0.5791 0.0361 0.2581 0.0026 0.8213 NB: Do not use R for this part of the question. two numbers rolled. Write an R function...
 3 a) Suppose that we wish to generate observations from the discrete distribution with probability mass function 2)+1 20 x=1,2, 3, 4, 5 Clearly describe the algorithm to do this and give the random numbers corresponding to the following uniform(0,1) sample. 0.5197 0.1790 0.9994 0.6873 0.7294 0.5791 0.0361 0.2581 0.0026 0.8213 NB: Do not use R for this part of the question. two numbers rolled. Write an R function which will generate n random rolls of a pair b) Consider...
 7. Suppose X1, X2, ..., Xn is a random sample from an exponential distribution with parameter K. (Remember f(x;2) = 2e-Ax is the pdf for the exponential dist”.) a) Find the likelihood function, L(X1, X2, ..., Xn). b) Find the log-likelihood function, b = log L. c) Find dl/d, set the result = 0 and solve for 2.
 7. (15 pts) Suppose X1, X2, ..., X, is a random sample from an exponential distribution with parameter 2. (Remember f(x;2) = ne-^x is the pdf for the exponential dista.) a) Find the likelihood function, L(X1, X2, Xn). b) Find the log-likelihood function, I = log L. c) Find d //d, set the result = 0 and solve for 2.
 4. In Uganda only 9% of the population has access to electricity. Suppose we randomly sample 20 people in Uganda. Let X be the number of people in our sample who have access to electricity. (a) What distribution will X have? (Hint: X only takes on the values 0, 1, ... 19, 20, so it can't be a continuous distribution.) (b) Find the mean and standard deviation for X. (c) Find the probability that 10 people or less in the...
 Using R,
Exercise 4 (CLT Simulation) For this exercise we will simulate from the exponential distribution. If a random variable X has an exponential distribution with rate parameter A, the pdf of X can be written for z 2 0 Also recall, (a) This exercise relies heavily on generating random observations. To make this reproducible we will set a seed for the randomization. Alter the following code to make birthday store your birthday in the format yyyymmdd. For example, William...
Using R,
Exercise 4 (CLT Simulation) For this exercise we will simulate from the exponential distribution. If a random variable X has an exponential distribution with rate parameter A, the pdf of X can be written for z 2 0 Also recall, (a) This exercise relies heavily on generating random observations. To make this reproducible we will set a seed for the randomization. Alter the following code to make birthday store your birthday in the format yyyymmdd. For example, William...
Most questions answered within 3 hours.
-
Where is the error in this code sequence?
String s1 = "Hello";
String s2 = "ello";...
asked 10 months ago -
Financial data for Joel de Paris, Inc., for last year
follow:
Joel de Paris, Inc.
Balance...
asked 10 months ago -
Consider this reaction:
Al2(SO4)3 (aq)+ BaCl3
(aq) Al2Cl6 (aq)- +
3BaSO4(s) . What is the...
asked 10 months ago -
Suppose that Savneet is considering increasing her
recent random sample from 20 car rentals to 40...
asked 10 months ago -
Trucks arrive at an unloading terminal at an average rate of 120
per hour.
Trucks arrive...
asked 10 months ago -
Why are methanol and ethanol completely soluble in water while
octanol is not very little soluble....
asked 10 months ago -
A facilities manager at a university reads in a research report
that the mean amount of...
asked 10 months ago -
When the CuSO4 is rehydrated by adding water to the anhydrous
compound, is this an endothermic...
asked 10 months ago -
A ray of sunlight is passing from diamond into crown glass; the
angle of incidence is...
asked 10 months ago -
A block of mass 0.249 kg is placed on top of a light, vertical
spring of...
asked 10 months ago -
how do the kidneys compensate in the presences of acidosis
a) trigger hyperventilate
b) reserve acid...
asked 10 months ago -
Question 501 pts
The rental rate of capital to the firm increases. Which of the
following...
asked 10 months ago