Acme Manufacturing Forecasting Analysis Paralysis Acme produces technology parts used by the manufacturers of self-driving vehicles....
Acme Manufacturing
Forecasting Analysis Paralysis
Acme produces technology parts used by the manufacturers of self-driving vehicles. The primary demand for Acme’s four products is dependent on the output of the manufacturer’s MRP systems. Acme produces the required quantities for the manufacturers and ships them just-in-time to reach the production lines. Acme also must provide inventory to support the repair of vehicles after they are sold to consumers. To meet this additional demand, they augment their internal production plans by adding some amount for a spare parts inventory. Inaccuracy in this process for spare parts has generated significant complaints from repair facilities who order the parts and expect them to be available for immediate shipping.
Since Acme’s background was manufacturing, they had no need for forecasting methods and initially their simple process of having the production scheduler add quantities to production runs as he saw fit actually worked. Anything not shipped to manufacturers remained in the warehouse to fill repair orders. However, increases in the demand for their products has created a situation where on any given day Acme is overstocked on some items and stocked out on others.
Pressure on both costs and customer service have forced management to seek more formal forecasting methods. Management has requested that you evaluate the repair demand for Acme’s five products and make appropriate recommendations.
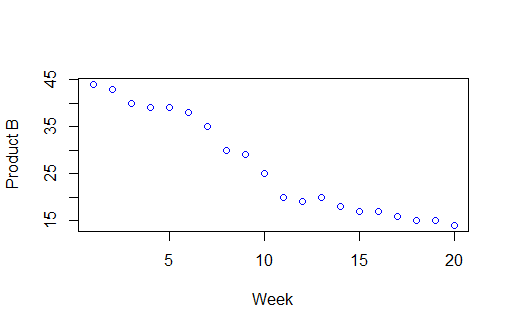
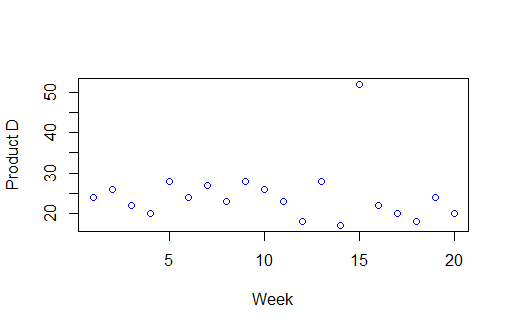
1a. Evaluate the historic demand of each item, discuss the demand pattern you detect, pertinent descriptive statistics, and any anomalies in the data (if anomalies are detected, make appropriate corrections).
1b. Recommend an appropriate forecasting method for each item. Justify your recommendation based on the historic demand pattern and the forecasting error.
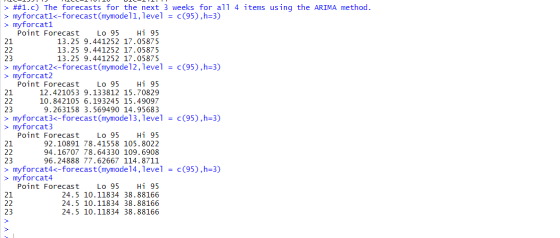
1c. Provide forecasts for the next 3 weeks for all 4 items using the methods you propose.
| Week | Product A | Product B | Product C | Product D |
| 1 | 14 | 44 | 50 | 24 |
| 2 | 13 | 43 | 54 | 26 |
| 3 | 12 | 40 | 57 | 22 |
| 4 | 16 | 39 | 60 | 20 |
| 5 | 18 | 39 | 61 | 28 |
| 6 | 13 | 38 | 63 | 24 |
| 7 | 14 | 35 | 66 | 27 |
| 8 | 13 | 30 | 90 | 23 |
| 9 | 12 | 29 | 68 | 28 |
| 10 | 10 | 25 | 71 | 26 |
| 11 | 14 | 20 | 74 | 23 |
| 12 | 13 | 19 | 75 | 18 |
| 13 | 15 | 20 | 74 | 28 |
| 14 | 12 | 18 | 77 | 17 |
| 15 | 11 | 17 | 79 | 52 |
| 16 | 10 | 17 | 83 | 22 |
| 17 | 12 | 16 | 83 | 20 |
| 18 | 14 | 15 | 85 | 18 |
| 19 | 15 | 15 | 88 | 24 |
| 20 | 14 | 14 | 90 | 20 |
Homework Answers
The attach images details solution in R-software given below
1.a)
 DDemand
pattern for each Product
DDemand
pattern for each Product
By trend 1 (Product A)

By trend-2 (Product B)
Trend-3 (product C)

Trend-4 (Product D)
1.b)
1.

2.
 3.
3.
 4
4
 5.
5.
 6
6

1.c) Forecastion the next 3 weeks for all 4 items using the methods of ARIMA (auto Regressive moving average method)
Add Answer to:
Acme Manufacturing
Forecasting Analysis Paralysis
Acme produces technology parts used by the manufacturers of
self-driving vehicles....
2. After building a scientific way for demand forecasting, Mary hoped Jason can propose the optimal...
2. After building a scientific way for demand forecasting, Mary hoped Jason can propose the optimal inventory/ordering policies for these 4 products for the first week of 2018. The sale price/unit for each product is listed below: Product A =$230 Product B=$50 Product C=$5 Product D=$3 Jason decided to use ABC rule to classify these 4 products. ‘A’ category product(s) will have the target service level 95%. ‘B’ product(s) will have the target service level 90% and ‘C’ products(s) will...
using the table and info below - Investigate the possibility by conventional forecasting methods (in other words the mov...
 using the table and info below
- Investigate the possibility by conventional forecasting methods
(in other words the moving averages) that the figure of 1600 units
will be exceeded in any of the next six months.
The sales factory manufacturing remotes over the last 24 months were as follows Units sold Month Units sold Month 1 440 13 1140 1 530 14 1 180 2 1 560 1 130 15 1 350 16 1 080 4 1 350 17 1...
using the table and info below
- Investigate the possibility by conventional forecasting methods
(in other words the moving averages) that the figure of 1600 units
will be exceeded in any of the next six months.
The sales factory manufacturing remotes over the last 24 months were as follows Units sold Month Units sold Month 1 440 13 1140 1 530 14 1 180 2 1 560 1 130 15 1 350 16 1 080 4 1 350 17 1...
data: (copy and paste in excel to view columns in alignment) Sample Repair Time (days) 1 ...
 data: (copy and paste in excel to view columns in alignment)
Sample Repair Time (days)
1 12
2 17
3 9
4 16
5 10
6 18
7 12
8 14
9 15
10 14
11 14
12 8
13 11
14 10
15 8
16 8
17 14
18 12
19 14
20 13
21 12
22 15
23 15
24 10
25 24
26 17
27 13
28 15
29 13
30 15
31 36
32 40
33 ...
data: (copy and paste in excel to view columns in alignment)
Sample Repair Time (days)
1 12
2 17
3 9
4 16
5 10
6 18
7 12
8 14
9 15
10 14
11 14
12 8
13 11
14 10
15 8
16 8
17 14
18 12
19 14
20 13
21 12
22 15
23 15
24 10
25 24
26 17
27 13
28 15
29 13
30 15
31 36
32 40
33 ...
1 A measurement systems experiment involving 20 parts, three operators, and two measurements per ...
 1 A measurement systems experiment involving 20 parts, three operators, and two measurements per part is shown in Table 8E. 12. (a) Estimate the repeatability and reproducibility of the gauge (b) What is the estimate of total gauge variability? (c) If the product specifications are at LSL 6 and USIL - 60, what ca you say about gauge capa bility? TABLE 8E. 12 Measurement Data for Exercise 8.34 Operator 1 Operator 2 Operator 3 Measurements Measurements Measurements Part Number 1...
Newcastle Industrial Manufacturers (NIM) manufactures parts that are used in large earthmoving trucks typically used in...
Newcastle Industrial Manufacturers (NIM) manufactures parts that are used in large earthmoving trucks typically used in the mining industry. It specialises in the production of 3 parts: A-12, P-37 and K-51. NIM has produced K-51 in high volume for many years, however demand has steadily declined over the past 2 years. NIM recently lost one of its major customers for the part as they were able to buy an equivalent part for 10% less form a foreign manufacturer. Recent analysis...
Based on historical data, daily demand of a product is normally distributed with a mean of...
 Based on historical data, daily demand of a product is normally
distributed with a mean of 200 and standard deviation of 50.
Develop a spreadsheet simulation model by simulating 300
observations of demand. After simulation freeze the simulated
demand values. Use Analysis ToolPak ? Histogram create a histogram
visualizing the demand distribution using bins: 100, 125, 150,
175,...,300. Use Analysis ToolPak ? Descriptive Statistics to
compute the descriptive statistics metrics of the simulated values.
Interpret skewness of the simulated demand....
Based on historical data, daily demand of a product is normally
distributed with a mean of 200 and standard deviation of 50.
Develop a spreadsheet simulation model by simulating 300
observations of demand. After simulation freeze the simulated
demand values. Use Analysis ToolPak ? Histogram create a histogram
visualizing the demand distribution using bins: 100, 125, 150,
175,...,300. Use Analysis ToolPak ? Descriptive Statistics to
compute the descriptive statistics metrics of the simulated values.
Interpret skewness of the simulated demand....
Write a Python program that tests the function main and the functions discussed in parts a...
 Write a Python program that tests the function main and the
functions discussed in parts a through g.
Create the following lists:
inStock - 2D list (row size:10, column
size:4)
alpha - 1D list with 20 elements.
beta - 1D list with 20 elements.
gamma = [11, 13, 15, 17]
delta = [3, 5, 2, 6, 10, 9, 7, 11, 1, 8]
a. Write the definition of the function setZero
that initializes any one-dimensional list to 0
(alpha and beta)....
Write a Python program that tests the function main and the
functions discussed in parts a through g.
Create the following lists:
inStock - 2D list (row size:10, column
size:4)
alpha - 1D list with 20 elements.
beta - 1D list with 20 elements.
gamma = [11, 13, 15, 17]
delta = [3, 5, 2, 6, 10, 9, 7, 11, 1, 8]
a. Write the definition of the function setZero
that initializes any one-dimensional list to 0
(alpha and beta)....
Problem5 While efficiency in the production operation is important to profitability,ACME Valve is also known for...
 Problem5 While efficiency in the production operation is important to profitability,ACME Valve is also known for high quality fieished products. Parts that do not meet specifications cannot be "reworked, so that both the raw material cost and the machine time to produce them are detrimental to profitability. Drills can become holes, and machines can get out of callbration as well For the parts in your department the critical dimension is the diameter of the center hole and design specifications require...
Taha Compagny produces three products: Product A, Product B, and Product C. During the year the...
Taha Compagny produces three products: Product A, Product B, and Product C. During the year the joint costs of processing the three products were $400,000. Production and sales value information were as follows: Sales Value Product Units at Split-Off Separable Costs Selling Price A 400,000 $20 per unit $ 20 per unit $40 per unit B 400,000 $18 per unit $ 15 per unit $28 per unit C 800,000 $12 per unit $14 per unit $17 per unit a. Allocate the joint costs using the physical output method. b. Allocate the joint costs using the net realizable value method....
Company produces three products: Product A, Product B, and Product C. During the year the...
Company produces three products: Product A, Product B, and Product C. During the year the joint costs of processing the three products were $400,000. Production and sales value information were as follows: Sales Value Product Units at Split-Off Separable Costs Selling Price A 400,000 $20 per unit $ 20 per unit $40 per unit B 400,000 $18 per unit $ 15 per unit $28 per unit C 800,000 $12 per unit $14...
 using the table and info below
- Investigate the possibility by conventional forecasting methods
(in other words the moving averages) that the figure of 1600 units
will be exceeded in any of the next six months.
The sales factory manufacturing remotes over the last 24 months were as follows Units sold Month Units sold Month 1 440 13 1140 1 530 14 1 180 2 1 560 1 130 15 1 350 16 1 080 4 1 350 17 1...
using the table and info below
- Investigate the possibility by conventional forecasting methods
(in other words the moving averages) that the figure of 1600 units
will be exceeded in any of the next six months.
The sales factory manufacturing remotes over the last 24 months were as follows Units sold Month Units sold Month 1 440 13 1140 1 530 14 1 180 2 1 560 1 130 15 1 350 16 1 080 4 1 350 17 1...
 data: (copy and paste in excel to view columns in alignment)
Sample Repair Time (days)
1 12
2 17
3 9
4 16
5 10
6 18
7 12
8 14
9 15
10 14
11 14
12 8
13 11
14 10
15 8
16 8
17 14
18 12
19 14
20 13
21 12
22 15
23 15
24 10
25 24
26 17
27 13
28 15
29 13
30 15
31 36
32 40
33 ...
data: (copy and paste in excel to view columns in alignment)
Sample Repair Time (days)
1 12
2 17
3 9
4 16
5 10
6 18
7 12
8 14
9 15
10 14
11 14
12 8
13 11
14 10
15 8
16 8
17 14
18 12
19 14
20 13
21 12
22 15
23 15
24 10
25 24
26 17
27 13
28 15
29 13
30 15
31 36
32 40
33 ...
 1 A measurement systems experiment involving 20 parts, three operators, and two measurements per part is shown in Table 8E. 12. (a) Estimate the repeatability and reproducibility of the gauge (b) What is the estimate of total gauge variability? (c) If the product specifications are at LSL 6 and USIL - 60, what ca you say about gauge capa bility? TABLE 8E. 12 Measurement Data for Exercise 8.34 Operator 1 Operator 2 Operator 3 Measurements Measurements Measurements Part Number 1...
 Based on historical data, daily demand of a product is normally
distributed with a mean of 200 and standard deviation of 50.
Develop a spreadsheet simulation model by simulating 300
observations of demand. After simulation freeze the simulated
demand values. Use Analysis ToolPak ? Histogram create a histogram
visualizing the demand distribution using bins: 100, 125, 150,
175,...,300. Use Analysis ToolPak ? Descriptive Statistics to
compute the descriptive statistics metrics of the simulated values.
Interpret skewness of the simulated demand....
Based on historical data, daily demand of a product is normally
distributed with a mean of 200 and standard deviation of 50.
Develop a spreadsheet simulation model by simulating 300
observations of demand. After simulation freeze the simulated
demand values. Use Analysis ToolPak ? Histogram create a histogram
visualizing the demand distribution using bins: 100, 125, 150,
175,...,300. Use Analysis ToolPak ? Descriptive Statistics to
compute the descriptive statistics metrics of the simulated values.
Interpret skewness of the simulated demand....
 Write a Python program that tests the function main and the
functions discussed in parts a through g.
Create the following lists:
inStock - 2D list (row size:10, column
size:4)
alpha - 1D list with 20 elements.
beta - 1D list with 20 elements.
gamma = [11, 13, 15, 17]
delta = [3, 5, 2, 6, 10, 9, 7, 11, 1, 8]
a. Write the definition of the function setZero
that initializes any one-dimensional list to 0
(alpha and beta)....
Write a Python program that tests the function main and the
functions discussed in parts a through g.
Create the following lists:
inStock - 2D list (row size:10, column
size:4)
alpha - 1D list with 20 elements.
beta - 1D list with 20 elements.
gamma = [11, 13, 15, 17]
delta = [3, 5, 2, 6, 10, 9, 7, 11, 1, 8]
a. Write the definition of the function setZero
that initializes any one-dimensional list to 0
(alpha and beta)....
 Problem5 While efficiency in the production operation is important to profitability,ACME Valve is also known for high quality fieished products. Parts that do not meet specifications cannot be "reworked, so that both the raw material cost and the machine time to produce them are detrimental to profitability. Drills can become holes, and machines can get out of callbration as well For the parts in your department the critical dimension is the diameter of the center hole and design specifications require...
Most questions answered within 3 hours.
-
Where is the error in this code sequence?
String s1 = "Hello";
String s2 = "ello";...
asked 10 months ago -
Financial data for Joel de Paris, Inc., for last year
follow:
Joel de Paris, Inc.
Balance...
asked 10 months ago -
Consider this reaction:
Al2(SO4)3 (aq)+ BaCl3
(aq) Al2Cl6 (aq)- +
3BaSO4(s) . What is the...
asked 10 months ago -
Suppose that Savneet is considering increasing her
recent random sample from 20 car rentals to 40...
asked 10 months ago -
Trucks arrive at an unloading terminal at an average rate of 120
per hour.
Trucks arrive...
asked 10 months ago -
Why are methanol and ethanol completely soluble in water while
octanol is not very little soluble....
asked 10 months ago -
A facilities manager at a university reads in a research report
that the mean amount of...
asked 10 months ago -
When the CuSO4 is rehydrated by adding water to the anhydrous
compound, is this an endothermic...
asked 10 months ago -
A ray of sunlight is passing from diamond into crown glass; the
angle of incidence is...
asked 10 months ago -
A block of mass 0.249 kg is placed on top of a light, vertical
spring of...
asked 10 months ago -
how do the kidneys compensate in the presences of acidosis
a) trigger hyperventilate
b) reserve acid...
asked 10 months ago -
Question 501 pts
The rental rate of capital to the firm increases. Which of the
following...
asked 10 months ago