The following is a multi-part problem, report the r code used for the following 1. Obtain...
The following is a multi-part problem, report the r code used for the following
1. Obtain 854 values at random from a uniform distribution where the smallest possible value is 10 and largest is 30. name the vector ex2. Consider ex2 the population.
2. Generate a histogram of ex2
3. Randomly obtain 7 samples with 10 observations in each sample from ex2 using sampling with replacement. Name the vector sam7. Calculate the mean for each sample and name that object sammean7.
4.Randomly obtain 70 samples with 10 observations in each sample from ex2 using sampling with replacement. Name the vector sam70. Calculate the mean for each sample and name that object sammean70.
5. Calculate the mean and standard deviation of ex2, sam7, sam70
6. Which sample has estimates closer to the corresponding parameter (true population mean).
Homework Answers


a) and b) The above R commands generates 854 random values from Uniform Distribution with min value as 10 and max value as 30 using the command runif. The vector is stored in ex2 and the histogram is made using the command hist in R and the graph shows the uniform distribution.

c) sammean is a function that has been created in R, in this function just pass the argument as number of sample required and it will calculate the mean of those many samples with 10 observations each. Hence, the mean for 7 samples of 10 observations each from uniform distribution is 20.20 as shown above.
d) Similarly, just changing the value to 70 in the argument of the function sammean will give the mean os 70 samples of 10 observations each which is equal to 20.18
e) Similarly, we have the function which calculates standard deviation in a similar way as mean

So, samsd is the function which will calculate the standard deviation for 7 samples or 70 samples, shown below
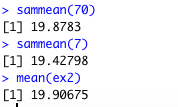
mean(ex2) = 19.90
mean(sam7)= 19.42
mean(sam70) = 19.87
Also, for standard deviation,
sd(ex2) = 5.75
sd(sam7)= 5.59
sd(sam70)= 5.66
From mean and standard deviation, we see that the mean and standard deviation of 70 samples is more close to the true population mean and standard deviation.
Add Answer to:
The following is a multi-part problem, report the r code used
for the following
1. Obtain...
, Samples In 30) drawn from a uniform distribution la Minitab was used to generate the...
 , Samples In 30) drawn from a uniform distribution la Minitab was used to generate the samples. es 300, b 500) Variables 15 Observations Variable TypeFormValues Missing Sample 1 Quantitative Sample 2 Quantitative Numeric Sample 3 Quantitative Numeric Sample 4 Quantitative Sample 5 ive Sample 6 Quantitative Sample 7 Quantitative Observations Sample 8 Quantitative Numeric Sample 9 Quantitative Sample 10 Quantitative Sample 11 Quantitative Sample 12 Quantitative Sample 13 Quantitative Sample 14 Quantitative Sample 15 Quantitative Numeric Numeric Variable Numeric...
Consider the following population: (4,7, 10, 13). Note that the population mean is the following. 4+7+10+'13...
 Consider the following population: (4,7, 10, 13). Note that the population mean is the following. 4+7+10+'13 -8.5 (a) Suppose that a random sample of sine 2 is to be selected without replacement from this population. There are 12 possible samples (provided that the order in which observations are selected is taken into account): 4,7 4,10 4,13 7.4 7.10 7.13 10,4 10,7 10, 13 13,4 13,7 13, 10 Compute the sample mean for each of the 12 possible samples Sample Sample...
Using R, Exercise 4 (CLT Simulation) For this exercise we will simulate from the exponential distribution....
 Using R,
Exercise 4 (CLT Simulation) For this exercise we will simulate from the exponential distribution. If a random variable X has an exponential distribution with rate parameter A, the pdf of X can be written for z 2 0 Also recall, (a) This exercise relies heavily on generating random observations. To make this reproducible we will set a seed for the randomization. Alter the following code to make birthday store your birthday in the format yyyymmdd. For example, William...
Using R,
Exercise 4 (CLT Simulation) For this exercise we will simulate from the exponential distribution. If a random variable X has an exponential distribution with rate parameter A, the pdf of X can be written for z 2 0 Also recall, (a) This exercise relies heavily on generating random observations. To make this reproducible we will set a seed for the randomization. Alter the following code to make birthday store your birthday in the format yyyymmdd. For example, William...
Sample variability 74 Using the phone numbers listed in your directory as your population, obtain randomly...
 Sample variability
74 Using the phone numbers listed in your directory as your population, obtain randomly 20 samples of size 3. From each phone number identified as a source, take the fourth, fifth, and sixth digits. (For example, for 245-8268, you would take the 8, the 2, and the 6 as your sample of size 3.) a. Calculate the mean of the 20 samples. b. Draw a histogram showing the 20 sample means. (Use classes-0.5 to 0.5, 0.5 to 1.5,...
Sample variability
74 Using the phone numbers listed in your directory as your population, obtain randomly 20 samples of size 3. From each phone number identified as a source, take the fourth, fifth, and sixth digits. (For example, for 245-8268, you would take the 8, the 2, and the 6 as your sample of size 3.) a. Calculate the mean of the 20 samples. b. Draw a histogram showing the 20 sample means. (Use classes-0.5 to 0.5, 0.5 to 1.5,...
1. Three randomly selected households are surveyed. The numbers of people in the households are 3, 4 and 11. Assume that samples of size n=2 are randomly selected with replacement from the populatio...
1. Three randomly selected households are surveyed. The numbers of people in the households are 3, 4 and 11. Assume that samples of size n=2 are randomly selected with replacement from the population of3, 4, and 11. Listed below are the nine different samples. Complete parts (a) through (c).3,3 3,4 3,11 4,3 4,4 4,11 11,3 11,4 11,11a. Find the variance of each of the nine samples, then summarize the sampling distribution of the variances in the format of a table...
Data Se Sample Variables 1 Proportions Observations 1000 p-bar for 1,000 samples (n 50] drawn fro...
 Data Se Sample Variables 1 Proportions Observations 1000 p-bar for 1,000 samples (n 50] drawn from a binomial population (p 0.30) Minitab was used to generate the samples. Observations> Observations Variable Type Form Values Missing Sample Proportion Quantitative Numeric 1000 Variable Correlation Correlation If the sample you select for your statistical study is one of the 1,000 samples we drew in our repeated sampling, the worst-luck sample you could draw proportion. Use the tool to sort the observed values of...
Question 1. Consider the following population data on weekly earnings after taxes of single- parent households...
 Question 1. Consider the following population data on weekly earnings after taxes of single- parent households in a small Ontario town. Weekly Index i Earnings 1220 1000 400 1400 i)Find the population average, variance and median weekly earnings. i) Construct a histogram with 3 equal length intervals for the population data ii) If samples of n-2 individuals were drawn without replacement from the population, how many distinct samples would be possible? Generate the possible samples of n-2 individuals drawn without...
Using R programming language, supply the code for: Generate a random sample of size 10, 000...
Using R programming language, supply the code for: Generate a random sample of size 10, 000 from gamma distribution with scale parameter equal to 1 and shape parameter equal to 2, and form it into a 1000 x 10 matrix. Use the apply() function on this matrix to compute the means of the 1000 rows. Note that the resulting vector comprises the mean of 1000 random samples of size 10 from the above distribution. Examine the distribution of the sample...
Selecting a random sample is an example of a statistical experiment, and the sample statistic p i...
 Selecting a random sample is an example of a statistical experiment, and the sample statistic p is a numerical description of the result of the experiment. Therefore, p is a random variable. The probability distribution of p is called the sampling distribution of p In practice, you select one random sample and use the information from that sample to estimate the population parameter of interest. However statisticians sometimes perform a procedure called repeated sampling, in which the experiment is run...
6. The sampling distribution of the sample proportion Aa Aa In 2007, about 14% of new-car purchas...
 6. The sampling distribution of the sample proportion Aa Aa In 2007, about 14% of new-car purchases in New York were financed with a home equity loan. [Source: "Auto Industry Feels the Pain of Tight Credit," The New York Times, May 27, 2008.] The ongoing process of new-car purchases in New York can be viewed as an infinite population Define p as the proportion of the population of new-car purchases in New York that are financed with a home equity...
 , Samples In 30) drawn from a uniform distribution la Minitab was used to generate the samples. es 300, b 500) Variables 15 Observations Variable TypeFormValues Missing Sample 1 Quantitative Sample 2 Quantitative Numeric Sample 3 Quantitative Numeric Sample 4 Quantitative Sample 5 ive Sample 6 Quantitative Sample 7 Quantitative Observations Sample 8 Quantitative Numeric Sample 9 Quantitative Sample 10 Quantitative Sample 11 Quantitative Sample 12 Quantitative Sample 13 Quantitative Sample 14 Quantitative Sample 15 Quantitative Numeric Numeric Variable Numeric...
 Consider the following population: (4,7, 10, 13). Note that the population mean is the following. 4+7+10+'13 -8.5 (a) Suppose that a random sample of sine 2 is to be selected without replacement from this population. There are 12 possible samples (provided that the order in which observations are selected is taken into account): 4,7 4,10 4,13 7.4 7.10 7.13 10,4 10,7 10, 13 13,4 13,7 13, 10 Compute the sample mean for each of the 12 possible samples Sample Sample...
 Using R,
Exercise 4 (CLT Simulation) For this exercise we will simulate from the exponential distribution. If a random variable X has an exponential distribution with rate parameter A, the pdf of X can be written for z 2 0 Also recall, (a) This exercise relies heavily on generating random observations. To make this reproducible we will set a seed for the randomization. Alter the following code to make birthday store your birthday in the format yyyymmdd. For example, William...
Using R,
Exercise 4 (CLT Simulation) For this exercise we will simulate from the exponential distribution. If a random variable X has an exponential distribution with rate parameter A, the pdf of X can be written for z 2 0 Also recall, (a) This exercise relies heavily on generating random observations. To make this reproducible we will set a seed for the randomization. Alter the following code to make birthday store your birthday in the format yyyymmdd. For example, William...
 Sample variability
74 Using the phone numbers listed in your directory as your population, obtain randomly 20 samples of size 3. From each phone number identified as a source, take the fourth, fifth, and sixth digits. (For example, for 245-8268, you would take the 8, the 2, and the 6 as your sample of size 3.) a. Calculate the mean of the 20 samples. b. Draw a histogram showing the 20 sample means. (Use classes-0.5 to 0.5, 0.5 to 1.5,...
Sample variability
74 Using the phone numbers listed in your directory as your population, obtain randomly 20 samples of size 3. From each phone number identified as a source, take the fourth, fifth, and sixth digits. (For example, for 245-8268, you would take the 8, the 2, and the 6 as your sample of size 3.) a. Calculate the mean of the 20 samples. b. Draw a histogram showing the 20 sample means. (Use classes-0.5 to 0.5, 0.5 to 1.5,...
 Data Se Sample Variables 1 Proportions Observations 1000 p-bar for 1,000 samples (n 50] drawn from a binomial population (p 0.30) Minitab was used to generate the samples. Observations> Observations Variable Type Form Values Missing Sample Proportion Quantitative Numeric 1000 Variable Correlation Correlation If the sample you select for your statistical study is one of the 1,000 samples we drew in our repeated sampling, the worst-luck sample you could draw proportion. Use the tool to sort the observed values of...
 Question 1. Consider the following population data on weekly earnings after taxes of single- parent households in a small Ontario town. Weekly Index i Earnings 1220 1000 400 1400 i)Find the population average, variance and median weekly earnings. i) Construct a histogram with 3 equal length intervals for the population data ii) If samples of n-2 individuals were drawn without replacement from the population, how many distinct samples would be possible? Generate the possible samples of n-2 individuals drawn without...
 Selecting a random sample is an example of a statistical experiment, and the sample statistic p is a numerical description of the result of the experiment. Therefore, p is a random variable. The probability distribution of p is called the sampling distribution of p In practice, you select one random sample and use the information from that sample to estimate the population parameter of interest. However statisticians sometimes perform a procedure called repeated sampling, in which the experiment is run...
 6. The sampling distribution of the sample proportion Aa Aa In 2007, about 14% of new-car purchases in New York were financed with a home equity loan. [Source: "Auto Industry Feels the Pain of Tight Credit," The New York Times, May 27, 2008.] The ongoing process of new-car purchases in New York can be viewed as an infinite population Define p as the proportion of the population of new-car purchases in New York that are financed with a home equity...
Most questions answered within 3 hours.
-
Where is the error in this code sequence?
String s1 = "Hello";
String s2 = "ello";...
asked 10 months ago -
Financial data for Joel de Paris, Inc., for last year
follow:
Joel de Paris, Inc.
Balance...
asked 10 months ago -
Consider this reaction:
Al2(SO4)3 (aq)+ BaCl3
(aq) Al2Cl6 (aq)- +
3BaSO4(s) . What is the...
asked 10 months ago -
Suppose that Savneet is considering increasing her
recent random sample from 20 car rentals to 40...
asked 10 months ago -
Trucks arrive at an unloading terminal at an average rate of 120
per hour.
Trucks arrive...
asked 10 months ago -
Why are methanol and ethanol completely soluble in water while
octanol is not very little soluble....
asked 10 months ago -
A facilities manager at a university reads in a research report
that the mean amount of...
asked 10 months ago -
When the CuSO4 is rehydrated by adding water to the anhydrous
compound, is this an endothermic...
asked 10 months ago -
A ray of sunlight is passing from diamond into crown glass; the
angle of incidence is...
asked 10 months ago -
A block of mass 0.249 kg is placed on top of a light, vertical
spring of...
asked 10 months ago -
how do the kidneys compensate in the presences of acidosis
a) trigger hyperventilate
b) reserve acid...
asked 10 months ago -
Question 501 pts
The rental rate of capital to the firm increases. Which of the
following...
asked 10 months ago