Professor Hill in the music department kept a list of the number of students visiting his...
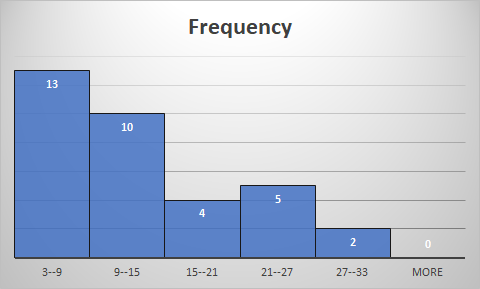
Professor Hill in the music department kept a list of the number of students visiting his office each week. Results for the past 34 weeks are shown below:
15 23 17 13 3 9 7 6 8 11
16 32 27 4 20 3 28 5 6 11
20 12 8 10 25 10 8 15 11 9
14 9 22 22.
c. Draw/make a histogram with five classes.
d. Identify the basic distribution shape as a mound-shaped symmetric, skewed left, or skewed right.
e. Draw/make a frequency polygon
Homework Answers
| Bin | Frequency |
| 9 | 13 |
| 15 | 10 |
| 21 | 4 |
| 27 | 5 |
| 33 | 2 |
| More | 0 |
==============================
Right Skewed
==============================

Add Answer to:
Professor Hill in the music department kept a list of the number
of students visiting his...
Will rate!! The number of contaminating particles on a silicon wafer prior to a certain rinsing...
 Will rate!!
The number of contaminating particles on a silicon wafer prior to a certain rinsing process was determined for each wafer in a sample of size 100, resulting in the following frequencies Number of particles Frequency 1 2 3 4 5 6 7 8 9 1011 12 13 14 1 3 3 12 11 15 19 10104 2 Draw a histogram using relative frequency on the vertical axis Percent Percent 15 10 Number 01234567 8 9 10111213 14 :İİI!!!.10:12...
Will rate!!
The number of contaminating particles on a silicon wafer prior to a certain rinsing process was determined for each wafer in a sample of size 100, resulting in the following frequencies Number of particles Frequency 1 2 3 4 5 6 7 8 9 1011 12 13 14 1 3 3 12 11 15 19 10104 2 Draw a histogram using relative frequency on the vertical axis Percent Percent 15 10 Number 01234567 8 9 10111213 14 :İİI!!!.10:12...
A. B. .is the shape of this graph -skewed to the left skewed to the right...
 A.
B. .is the shape of this graph
-skewed to the left
skewed to the right
or
symmetric
We were unable to transcribe this imageA histogram for a set of data is shown below: Which describes the shape of the distribution? 30 25 20 DCount 15 10 1 2 3 45 6 7 8 9 10 11
A.
B. .is the shape of this graph
-skewed to the left
skewed to the right
or
symmetric
We were unable to transcribe this imageA histogram for a set of data is shown below: Which describes the shape of the distribution? 30 25 20 DCount 15 10 1 2 3 45 6 7 8 9 10 11
A simple random sample of 40 college students was surveyed. The number of participants in given...
A simple random sample of 40 college students was surveyed. The number of participants in given age ranges were recorded in the table below. Complete the table, computing the class midpoints, relative frequencies, cumulative frequencies and the cumulative relative frequencies for each class. Express answers as decimals rounded to 2 decimal places. Then use the table to answer the following questions. Ages Class Midpoint Frequency Rel. Freq. Cumulative Freq. Cumulative Rel. Freq 15-24 20 25-34 16 35-44 8 45-54 4...
The number of contaminating particles on a silicon wafer prior to a certain rinsing process was...
 The number of contaminating particles on a silicon wafer prior
to a certain rinsing process was determined for each wafer in a
sample of size 100, resulting in the following frequencies:
Number of particles
0
1
2
3
4
5
6
7
8
9
10
11
12
13
14
Frequency
1
3
3
12
11
15
16
10
12
4
5
3
2
2
1
(a) What proportion of the sampled wafers had at least one
particle? At least...
The number of contaminating particles on a silicon wafer prior
to a certain rinsing process was determined for each wafer in a
sample of size 100, resulting in the following frequencies:
Number of particles
0
1
2
3
4
5
6
7
8
9
10
11
12
13
14
Frequency
1
3
3
12
11
15
16
10
12
4
5
3
2
2
1
(a) What proportion of the sampled wafers had at least one
particle? At least...
Seventy-five managers were surveyed for the number of days they spent traveling each year. (a) Which...
Seventy-five managers were surveyed for the number of days they spent traveling each year. (a) Which of these best describes the shape of the distribution of the data given in the table? Days traveled per year Frequency i) Bell-shaped 0-6 15 ii) Skewed right 7-13 21 iii) Skewed left 14-20 27 21-27 9 28-34 2 (b) Extend the frequency table given at the right to include a column for relative frequency. The column should include the values of relative frequency...
34) 341) To avoid working late, the quality control manager inspects the last 50 items p day A) cluster B) random D) stratified 35) 35) A lobbyist for a major airspace firm assigns a number to ea...
 34) 341) To avoid working late, the quality control manager inspects the last 50 items p day A) cluster B) random D) stratified 35) 35) A lobbyist for a major airspace firm assigns a number to each legislator and then uses a computer to randomly generate ten numbers. The lobbyist contacts the legislators corresponding to these numbers. A) stratified B) convenience C) systematic D) random E) cluster 36) Identify the data set's level of measurement 36) the years the summer...
frequency table histogram frequency polygon ogive 100% (?) New Open Save Print Import Copy Paste Format...
 frequency table histogram frequency polygon
ogive
100% (?) New Open Save Print Import Copy Paste Format Undo Redo AutoSum Sort A-Z Sort Z-A Gallery Toolbox Zoom Help Charts SmartArt Gr Word Protein Grams In Fast Food 223 3 25 12 38 22 21 427 27 1429 27 42 34 35 23 12 27 29 15 31 6 30 7 15 57 35 9 35 10 20 11 18 12 24 20 26 19 35 Tasks 1. Complete the fequency table...
frequency table histogram frequency polygon
ogive
100% (?) New Open Save Print Import Copy Paste Format Undo Redo AutoSum Sort A-Z Sort Z-A Gallery Toolbox Zoom Help Charts SmartArt Gr Word Protein Grams In Fast Food 223 3 25 12 38 22 21 427 27 1429 27 42 34 35 23 12 27 29 15 31 6 30 7 15 57 35 9 35 10 20 11 18 12 24 20 26 19 35 Tasks 1. Complete the fequency table...
a survey asked 50 baseball fans to report the number of games they attented last year....
a survey asked 50 baseball fans to report the number of games they attented last year. The results of the survey are presented below. Construct a histogram using the data. What can you tell about how the data is distributed given your histogram? 5 16 11 8 8 8 5 11 14 10 15 26 15 19 7 6 24 20 9 18 14 6 6 16 10 6 5 24 25 22 7 15 4 9 5 21 28...
2. The following data show the number of cars that arrived at a Tim-Hortons drive-through between...
2. The following data show the number of cars that arrived at a Tim-Hortons drive-through between 10:00 AM and 11:00 AM each Monday for the past 50 weeks: 1 6 5 4 2 7 5 3 4 5 3 6 6 9 6 8 4 3 3 1 2 3 3 5 7 3 4 4 2 1 8 3 3 3 5 2 8 2 5 3 6 1 1 5 8 3 2 2 5 4 (a) Construct...
For each variable of interest – Percent Time Asleep and Longevity – create a grouped frequency...
For each variable of interest – Percent Time Asleep and Longevity – create a grouped frequency histogram. For each histogram, use a class width of 10; use a lower limit of 0 for Percent Time Asleep and 15 for Longevity. Each histogram must include an informative title, along with correct labels for both axes. For each histogram, include a paragraph that answers each of the following questions: Is the histogram symmetric, skewed to the left, or skewed to the right?...
 Will rate!!
The number of contaminating particles on a silicon wafer prior to a certain rinsing process was determined for each wafer in a sample of size 100, resulting in the following frequencies Number of particles Frequency 1 2 3 4 5 6 7 8 9 1011 12 13 14 1 3 3 12 11 15 19 10104 2 Draw a histogram using relative frequency on the vertical axis Percent Percent 15 10 Number 01234567 8 9 10111213 14 :İİI!!!.10:12...
Will rate!!
The number of contaminating particles on a silicon wafer prior to a certain rinsing process was determined for each wafer in a sample of size 100, resulting in the following frequencies Number of particles Frequency 1 2 3 4 5 6 7 8 9 1011 12 13 14 1 3 3 12 11 15 19 10104 2 Draw a histogram using relative frequency on the vertical axis Percent Percent 15 10 Number 01234567 8 9 10111213 14 :İİI!!!.10:12...
 A.
B. .is the shape of this graph
-skewed to the left
skewed to the right
or
symmetric
We were unable to transcribe this imageA histogram for a set of data is shown below: Which describes the shape of the distribution? 30 25 20 DCount 15 10 1 2 3 45 6 7 8 9 10 11
A.
B. .is the shape of this graph
-skewed to the left
skewed to the right
or
symmetric
We were unable to transcribe this imageA histogram for a set of data is shown below: Which describes the shape of the distribution? 30 25 20 DCount 15 10 1 2 3 45 6 7 8 9 10 11
 The number of contaminating particles on a silicon wafer prior
to a certain rinsing process was determined for each wafer in a
sample of size 100, resulting in the following frequencies:
Number of particles
0
1
2
3
4
5
6
7
8
9
10
11
12
13
14
Frequency
1
3
3
12
11
15
16
10
12
4
5
3
2
2
1
(a) What proportion of the sampled wafers had at least one
particle? At least...
The number of contaminating particles on a silicon wafer prior
to a certain rinsing process was determined for each wafer in a
sample of size 100, resulting in the following frequencies:
Number of particles
0
1
2
3
4
5
6
7
8
9
10
11
12
13
14
Frequency
1
3
3
12
11
15
16
10
12
4
5
3
2
2
1
(a) What proportion of the sampled wafers had at least one
particle? At least...
 34) 341) To avoid working late, the quality control manager inspects the last 50 items p day A) cluster B) random D) stratified 35) 35) A lobbyist for a major airspace firm assigns a number to each legislator and then uses a computer to randomly generate ten numbers. The lobbyist contacts the legislators corresponding to these numbers. A) stratified B) convenience C) systematic D) random E) cluster 36) Identify the data set's level of measurement 36) the years the summer...
 frequency table histogram frequency polygon
ogive
100% (?) New Open Save Print Import Copy Paste Format Undo Redo AutoSum Sort A-Z Sort Z-A Gallery Toolbox Zoom Help Charts SmartArt Gr Word Protein Grams In Fast Food 223 3 25 12 38 22 21 427 27 1429 27 42 34 35 23 12 27 29 15 31 6 30 7 15 57 35 9 35 10 20 11 18 12 24 20 26 19 35 Tasks 1. Complete the fequency table...
frequency table histogram frequency polygon
ogive
100% (?) New Open Save Print Import Copy Paste Format Undo Redo AutoSum Sort A-Z Sort Z-A Gallery Toolbox Zoom Help Charts SmartArt Gr Word Protein Grams In Fast Food 223 3 25 12 38 22 21 427 27 1429 27 42 34 35 23 12 27 29 15 31 6 30 7 15 57 35 9 35 10 20 11 18 12 24 20 26 19 35 Tasks 1. Complete the fequency table...
Most questions answered within 3 hours.
-
Where is the error in this code sequence?
String s1 = "Hello";
String s2 = "ello";...
asked 11 months ago -
Financial data for Joel de Paris, Inc., for last year
follow:
Joel de Paris, Inc.
Balance...
asked 11 months ago -
Consider this reaction:
Al2(SO4)3 (aq)+ BaCl3
(aq) Al2Cl6 (aq)- +
3BaSO4(s) . What is the...
asked 11 months ago -
Suppose that Savneet is considering increasing her
recent random sample from 20 car rentals to 40...
asked 11 months ago -
Trucks arrive at an unloading terminal at an average rate of 120
per hour.
Trucks arrive...
asked 11 months ago -
Why are methanol and ethanol completely soluble in water while
octanol is not very little soluble....
asked 11 months ago -
A facilities manager at a university reads in a research report
that the mean amount of...
asked 11 months ago -
When the CuSO4 is rehydrated by adding water to the anhydrous
compound, is this an endothermic...
asked 11 months ago -
A ray of sunlight is passing from diamond into crown glass; the
angle of incidence is...
asked 11 months ago -
A block of mass 0.249 kg is placed on top of a light, vertical
spring of...
asked 11 months ago -
how do the kidneys compensate in the presences of acidosis
a) trigger hyperventilate
b) reserve acid...
asked 11 months ago -
Question 501 pts
The rental rate of capital to the firm increases. Which of the
following...
asked 11 months ago