Using Excel, create scatter plots and display the regression equations for the following pairs of variables:...
- Using Excel, create scatter plots and display the regression equations for the following pairs of variables:
- ““LoyaltyCard(%)” versus “SalesGrowth(%)”
- In your report, include the scatter plots. For each scatter plot, designate the type of relationship observed (increasing/positive, decreasing/negative, or no relationship) and determine what you can conclude from these relationships.
LoyaltyCard%
2.07 2.54 1.66 2.06 2.48 2.96 2.28 2.34 2.20 2.34 2.09 2.47 2.04 2.02 2.01 2.64 2.22 2.07 1.94 2.17 0.72 2.00 1.81 2.13 2.50 2.63 1.95 2.04 1.41 2.05 2.13 2.08 2.73 1.95 2.04 1.62 1.95 1.64 1.78 2.23 2.15 2.83 2.37 3.07 2.19 1.28 1.76 2.51 1.90 1.98 2.41 2.17 2.16 0.29 1.85 1.88 2.19 2.56 2.16 2.10 1.98 0.87 1.07 3.38 1.17 2.14 0.93 2.22 1.68 2.41 2.81 1.09 0.64 1.77
SalesGrowth%
-8.31 -4.01 -3.94 -3.39 -3.30 -1.94 -0.77 -0.37 -0.25 -0.17 0.47 0.55 0.77 1.92 2.05 2.12 2.84 2.88 3.96 4.04 4.05 4.05 4.24 4.58 5.09 5.14 5.48 5.86 5.91 5.98 6.08 6.08 6.13 6.27 6.57 6.90 6.94 7.12 7.39 7.67 7.91 8.08 8.27 8.54 8.58 8.72 8.75 8.79 8.90 9.12 9.47 10.17 10.66 10.97 11.34 11.45 11.51 11.73 11.83 11.95 12.47 12.80 13.78 14.09 14.23 14.60 14.88 15.42 16.18 17.23 18.43 20.76 25.54 28.81
Homework Answers
We want to plot ““LoyaltyCard(%)” versus “SalesGrowth(%)”, That is “LoyaltyCard(%) on y axis and SalesGrowth(%) on the x axis
Arrange the columns such that we have “SalesGrowth(%)” in the first column and then “LoyaltyCard(%)”
Select the data and the use insert--->scatter as below
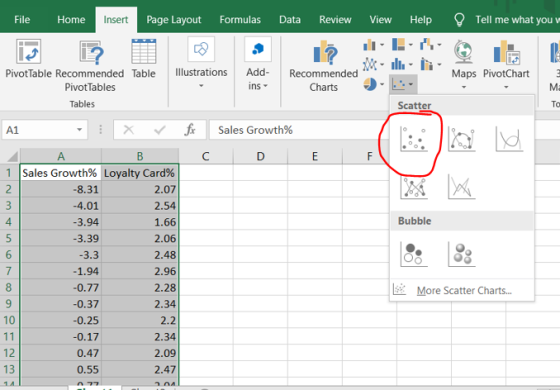
get this raw graph

format as required

select the dots by clicking on one of the dots and press the right mouse and select add trend line as given below

check the boxes as below

get this
ans:
The scatter plot with the regression equation for ““LoyaltyCard(%)” versus “SalesGrowth(%)” is

The regression equation is

where y=Loyaly card %
x=Sales Growth %
We can see that the slope coefficient of x is negative. This indicates that there is a decreasing/negative relationship between Loyaly card % and Sales Growth %. Further, we can say that for 1 % point increase in the sales growth, the loyarly card decreases by 0.0247%
Add Answer to:
Using Excel, create scatter plots and display the regression
equations for the following pairs of variables:...
Can someone help label both of these NMR spectra (each peak) for D-mannose and draw out...
 Can
someone help label both of these NMR spectra (each peak) for
D-mannose and draw out the structure. thank you
14,0 15,0 16,0 142.64 11.0 12.0 13.0 001 2.0 02 09 OS 3.0 02 15.17 15.12 abundance 5.7 5.6 55 54 53 5.2 5.1 5.0 49 48 47 4.6 4.5 44 43 42 41 40 39 38 37 36 35 34 33 32 3.13.0 29 28 27 26 25 24 23 22 21 20 19 18 17 16 Xparts per...
Can
someone help label both of these NMR spectra (each peak) for
D-mannose and draw out the structure. thank you
14,0 15,0 16,0 142.64 11.0 12.0 13.0 001 2.0 02 09 OS 3.0 02 15.17 15.12 abundance 5.7 5.6 55 54 53 5.2 5.1 5.0 49 48 47 4.6 4.5 44 43 42 41 40 39 38 37 36 35 34 33 32 3.13.0 29 28 27 26 25 24 23 22 21 20 19 18 17 16 Xparts per...
REGRESSION 2 • reg bught cigs faminc male Source SS df MS = = Model Residual...
 REGRESSION 2 • reg bught cigs faminc male Source SS df MS = = Model Residual 20477.12 554134.6 3 6825.70666 1,384 400.386272 Number of obs F(3, 1384) Prob > R-squared Adj R-squared Root MSE 1,388 17.05 0.0000 0.0356 0.0335 20.01 - Total 574611.72 1,387 414.283864 bwght Coef. Std. Err. Piti (95Conf. Intervall cigs famine male _cons -.4610457 0913378 .09687980291453 3.113968 1.076396 115.2277 1.20788 -5.050.000 3.32 0.001 2.89 0.004 95.400.000 -.6402212 .0397062 1.002423 112.8582 - 2818702 .1540535 5.225513 117.5972 f) Conduct...
Suppose 1000 coins are tossed. Use the normal curve approximation to the binomial distribution to find...
 Suppose 1000 coins are tossed. Use the normal curve approximation to the binomial distribution to find the probability of getting the following result. Exactly 495 heads Use the table of areas under the standard normal curve given below. Click here to view page 1. Click here to view page 2. Click here to view page 3. Click here to view page 4. Click here to view page 5. Click here to view page 6. The probability of getting exactly 495...
Suppose 16 coins are tossed. Use the normal curve approximation to the binomial distribution to find...
 Suppose 16 coins are tossed. Use the normal curve approximation to the binomial distribution to find the probability of getting the following result. More than 11 tails. Use the table of areas under the standard normal curve given below. Click here to view page 1. Click here to view page 2. Click here to view page 3. Click here to view page 4. Click here to view page 5. Click here to view page 6. Binomial probability = (Round to...
1. Two manufacturing processes are being compared to try to reduce the number of defective products...
 1. Two manufacturing processes are being compared to try to reduce the number of defective products made. During 8 shifts for each process, the following results were observed: Line A Line B n 181 | 187 Based on a 5% significance level, did line B have a larger average than line A? *Use the tables I gave you in the handouts for the critical values *Use the appropriate test statistic value, NOT the p-value method *Use and show the 5...
I ONLY NEED HELP WITH PART OF PART "B" I've figured out the test statistic is -1.73 and the degr...
 I ONLY NEED HELP WITH PART OF PART "B"
I've figured out the test statistic is -1.73 and the degrees of
freedom are 5. However, I'm having a hard time finding the P value
via the chart (which I'm required to learn how to do).I think the
chart immediately bellow this is the one used to find the p-value.
However, I know at least one (or more) of the charts bellow is
what's used. Please let me know which chart...
I ONLY NEED HELP WITH PART OF PART "B"
I've figured out the test statistic is -1.73 and the degrees of
freedom are 5. However, I'm having a hard time finding the P value
via the chart (which I'm required to learn how to do).I think the
chart immediately bellow this is the one used to find the p-value.
However, I know at least one (or more) of the charts bellow is
what's used. Please let me know which chart...
I ONLY NEED HELP WITH PART OF PART "B" I've figured out the test statistic is...
 I ONLY NEED HELP WITH PART OF PART "B"
I've figured out the test statistic is -1.73 and the degrees of
freedom are 5. However, I'm having a hard time finding the P value
via the chart (which I'm required to learn how to do).I think the
chart immediately bellow this is the one used to find the p-value.
However, I know at least one (or more) of the charts bellow is
what's used. Please let me know which chart...
I ONLY NEED HELP WITH PART OF PART "B"
I've figured out the test statistic is -1.73 and the degrees of
freedom are 5. However, I'm having a hard time finding the P value
via the chart (which I'm required to learn how to do).I think the
chart immediately bellow this is the one used to find the p-value.
However, I know at least one (or more) of the charts bellow is
what's used. Please let me know which chart...
 Can
someone help label both of these NMR spectra (each peak) for
D-mannose and draw out the structure. thank you
14,0 15,0 16,0 142.64 11.0 12.0 13.0 001 2.0 02 09 OS 3.0 02 15.17 15.12 abundance 5.7 5.6 55 54 53 5.2 5.1 5.0 49 48 47 4.6 4.5 44 43 42 41 40 39 38 37 36 35 34 33 32 3.13.0 29 28 27 26 25 24 23 22 21 20 19 18 17 16 Xparts per...
Can
someone help label both of these NMR spectra (each peak) for
D-mannose and draw out the structure. thank you
14,0 15,0 16,0 142.64 11.0 12.0 13.0 001 2.0 02 09 OS 3.0 02 15.17 15.12 abundance 5.7 5.6 55 54 53 5.2 5.1 5.0 49 48 47 4.6 4.5 44 43 42 41 40 39 38 37 36 35 34 33 32 3.13.0 29 28 27 26 25 24 23 22 21 20 19 18 17 16 Xparts per...
 REGRESSION 2 • reg bught cigs faminc male Source SS df MS = = Model Residual 20477.12 554134.6 3 6825.70666 1,384 400.386272 Number of obs F(3, 1384) Prob > R-squared Adj R-squared Root MSE 1,388 17.05 0.0000 0.0356 0.0335 20.01 - Total 574611.72 1,387 414.283864 bwght Coef. Std. Err. Piti (95Conf. Intervall cigs famine male _cons -.4610457 0913378 .09687980291453 3.113968 1.076396 115.2277 1.20788 -5.050.000 3.32 0.001 2.89 0.004 95.400.000 -.6402212 .0397062 1.002423 112.8582 - 2818702 .1540535 5.225513 117.5972 f) Conduct...
 Suppose 1000 coins are tossed. Use the normal curve approximation to the binomial distribution to find the probability of getting the following result. Exactly 495 heads Use the table of areas under the standard normal curve given below. Click here to view page 1. Click here to view page 2. Click here to view page 3. Click here to view page 4. Click here to view page 5. Click here to view page 6. The probability of getting exactly 495...
 Suppose 16 coins are tossed. Use the normal curve approximation to the binomial distribution to find the probability of getting the following result. More than 11 tails. Use the table of areas under the standard normal curve given below. Click here to view page 1. Click here to view page 2. Click here to view page 3. Click here to view page 4. Click here to view page 5. Click here to view page 6. Binomial probability = (Round to...
 1. Two manufacturing processes are being compared to try to reduce the number of defective products made. During 8 shifts for each process, the following results were observed: Line A Line B n 181 | 187 Based on a 5% significance level, did line B have a larger average than line A? *Use the tables I gave you in the handouts for the critical values *Use the appropriate test statistic value, NOT the p-value method *Use and show the 5...
 I ONLY NEED HELP WITH PART OF PART "B"
I've figured out the test statistic is -1.73 and the degrees of
freedom are 5. However, I'm having a hard time finding the P value
via the chart (which I'm required to learn how to do).I think the
chart immediately bellow this is the one used to find the p-value.
However, I know at least one (or more) of the charts bellow is
what's used. Please let me know which chart...
I ONLY NEED HELP WITH PART OF PART "B"
I've figured out the test statistic is -1.73 and the degrees of
freedom are 5. However, I'm having a hard time finding the P value
via the chart (which I'm required to learn how to do).I think the
chart immediately bellow this is the one used to find the p-value.
However, I know at least one (or more) of the charts bellow is
what's used. Please let me know which chart...
Most questions answered within 3 hours.
-
Where is the error in this code sequence?
String s1 = "Hello";
String s2 = "ello";...
asked 10 months ago -
Financial data for Joel de Paris, Inc., for last year
follow:
Joel de Paris, Inc.
Balance...
asked 10 months ago -
Consider this reaction:
Al2(SO4)3 (aq)+ BaCl3
(aq) Al2Cl6 (aq)- +
3BaSO4(s) . What is the...
asked 10 months ago -
Suppose that Savneet is considering increasing her
recent random sample from 20 car rentals to 40...
asked 10 months ago -
Trucks arrive at an unloading terminal at an average rate of 120
per hour.
Trucks arrive...
asked 10 months ago -
Why are methanol and ethanol completely soluble in water while
octanol is not very little soluble....
asked 10 months ago -
A facilities manager at a university reads in a research report
that the mean amount of...
asked 10 months ago -
When the CuSO4 is rehydrated by adding water to the anhydrous
compound, is this an endothermic...
asked 10 months ago -
A ray of sunlight is passing from diamond into crown glass; the
angle of incidence is...
asked 10 months ago -
A block of mass 0.249 kg is placed on top of a light, vertical
spring of...
asked 10 months ago -
how do the kidneys compensate in the presences of acidosis
a) trigger hyperventilate
b) reserve acid...
asked 10 months ago -
Question 501 pts
The rental rate of capital to the firm increases. Which of the
following...
asked 10 months ago