In a study of the accuracy of fast food drive-through orders, Restaurant A had 257 accurate...
In a study of the accuracy of fast food drive-through orders, Restaurant A had 257 accurate orders and 58 that were not accurate.a. Construct a 90% confidence interval estimate of the percentage of orders that are not accurate.
b. Compare the results from part (a) to this 90% confidence interval for the percentage of orders that are not accurate at Restaurant B: 0.164 < p < 0.234 What do you conclude?
a. Construct a 90% confidence interval. Express the percentages in decimal form.
< p <
(Round to three decimal places as needed.)
b. Choose the correct answer below.
A. Since the two confidence intervals overlap, neither restaurant appears to have a significantly different percentage of orders that are not accurate.
B. The lower confidence limit of the interval for Restaurant B is higher than the lower confidence limit of the interval for Restaurant A and the upper confidence limit of the interval for Restaurant B is also higher than the upper confidence limit of the interval for Restaurant A. Therefore, Restaurant B has a significantly higher percentage of orders that are not accurate.
C. Since the upper confidence limit of the interval for Restaurant B is higher than both the lower and upper confidence limits of the interval for Restaurant A, this indicates that Restaurant B has a significantly higher percentage of orders that are not accurate.
D. No conclusion can be made because not enough information is given about the confidence interval for Restaurant B.
Homework Answers
The statistical software output for this problem is:
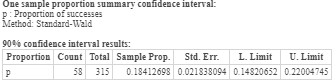
Hence,
a) 90% confidence interval:
0.148 < p < 0.220
b) Since the two confidence intervals overlap, neither restaurant appears to have a significantly different percentage of orders that are not accurate. Option A is correct.
Add Answer to:
In a study of the accuracy of fast food drive-through orders,
Restaurant A had 257 accurate...
In a study of the accuracy of fast food drive-through orders, Restaurant A had 340 accurate...
 In a study of the accuracy of fast food drive-through orders, Restaurant A had 340 accurate orders and 66 that were not accurate. a. Construct a 95% confidence interval estimate of the percentage of orders that are not accurate. b. Compare the results from part (a) to this 95% confidence interval for the percentage of orders that are not accurate at Restaurant B: 0.139 <p<0.211. What do you conclude? a. Construct a 95% confidence interval. Express the percentages in decimal...
In a study of the accuracy of fast food drive-through orders, Restaurant Ahad 265 accurate orders...
 In a study of the accuracy of fast food drive-through orders, Restaurant Ahad 265 accurate orders and 61 that were not accurate a. Construct a 95% confidence interval estimate of the percentage of orders that are not accurate b. Compare the results from part (a) to this 95% confidence interval for the percentage of orders that are not accurate at Restaurant B 0.167<p <0.244. What do you conclude? a. Construct a 95% confidence interval. Express the percentages in decimal form...
In a study of the accuracy of fast food drive-through orders, Restaurant Ahad 281 accurate orders...
 In a study of the accuracy of fast food drive-through orders, Restaurant Ahad 281 accurate orders and 69 that were not accurate. a. Construct a 95% confidence interval estimate of the percentage of orders that are not accurate, b. Compare the results from part (a) to this 95% confidence interval for the percentage of orders that are not accurate at Restaurant B: 0.174<p <0.266. What do you conclude? a. Construct a 95% confidence interval. Express the percentages in decimal form....
In a study of the accuracy of fast food drive-through orders, Restaurant A had 257 accurate...
In a study of the accuracy of fast food drive-through orders, Restaurant A had 257 accurate orders and 74 that were not accurate. a.) Construct a 90% confidence interval estimate of the percentage of orders that are not accurate. b.) Compare the results from part(a) to this 90% confidence interval for the percentage of orders that are not accurate at Restaurant B: 0.206< p < 0.279. What do you conclude? Express the percentages in decimal form.
In a study of the accuracy of fast food drive-through orders, Restaurant A had 245 accurate...
In a study of the accuracy of fast food drive-through orders, Restaurant A had 245 accurate orders and 66 that were not accurate. a. Construct a 90% confidence interval estimate of the percentage of orders that are not accurate. b. Compare the results from part (a) to this 90% confidence interval for the percentage of orders that are not accurate at Restaurant B: 0.192 < p < 0.275. What do you conclude? Construct a 90% confidence interval. Express the percentages...
In a study of the accuracy of fast food drive-through orders, Restaurant A had 253 accurate...
In a study of the accuracy of fast food drive-through orders, Restaurant A had 253 accurate orders and 74 that were not accurate. a. Construct a 90% confidence interval estimate of the percentage of orders that are not accurate. b. Compare the results from part (a) to this 90% confidence interval for the percentage of orders that are not accurate at Restaurant B: 0.2080 <p < 0.288 What do you conclude? a. Construct a 90% confidence interval. Express the percentages...
In a study of the accuracy of fast food drive-through orders, Restaurant A had 299 accurate...
 In a study of the accuracy of fast food drive-through orders, Restaurant A had 299 accurate orders and 56 that were not accurate. a. Construct a 95% confidence interval estimate of the percentage of orders that are not accurate. b Compare the results from part a to this 95% confidence interval for the percentage of orders that are not accurate at Restaurant B: 0.137 p <0.214. What do you conclude? a. Construct a 95% confidence interval. Express the percentages in...
In a study of the accuracy of fast food drive-through orders, Restaurant A had 283 accurate...
In a study of the accuracy of fast food drive-through orders, Restaurant A had 283 accurate orders and 55 that were not accurate. a. Construct a 95% confidence interval estimate of the percentage of orders that are not accurate. b. Compare the results from part (a) to this 95% confidence interval for the percentage of orders that are not accurate at Restaurant B: 0.147less thanpless than0.217. What do you conclude? a. Construct a 95% confidence interval. Express the percentages in...
In a study of the accuracy of fast food drive-through orders, Restaurant A had345 accurate orders...
In a study of the accuracy of fast food drive-through orders, Restaurant A had345 accurate orders and 69 that were not accurate. a. Construct a 90% confidence interval estimate of the percentage of orders that are not accurate. b. Compare the results from part (a) to this 90% confidence interval for the percentage of orders that are not accurate at Restaurant B: 0.156 less than 0.209
In a study of the accuracy of fast food drive-through orders, Restaurant A had 300 accurate...
In a study of the accuracy of fast food drive-through orders, Restaurant A had 300 accurate orders and 51 that were not accurate. a. Construct a 95% confidence interval estimate of the percentage of orders that are not accurate. b. Compare the results from part (a) to this 95% confidence interval for the percentage of orders that are not accurate at Restaurant B: 0.121<p<0.205. What do you conclude?
 In a study of the accuracy of fast food drive-through orders, Restaurant A had 340 accurate orders and 66 that were not accurate. a. Construct a 95% confidence interval estimate of the percentage of orders that are not accurate. b. Compare the results from part (a) to this 95% confidence interval for the percentage of orders that are not accurate at Restaurant B: 0.139 <p<0.211. What do you conclude? a. Construct a 95% confidence interval. Express the percentages in decimal...
 In a study of the accuracy of fast food drive-through orders, Restaurant Ahad 265 accurate orders and 61 that were not accurate a. Construct a 95% confidence interval estimate of the percentage of orders that are not accurate b. Compare the results from part (a) to this 95% confidence interval for the percentage of orders that are not accurate at Restaurant B 0.167<p <0.244. What do you conclude? a. Construct a 95% confidence interval. Express the percentages in decimal form...
 In a study of the accuracy of fast food drive-through orders, Restaurant Ahad 281 accurate orders and 69 that were not accurate. a. Construct a 95% confidence interval estimate of the percentage of orders that are not accurate, b. Compare the results from part (a) to this 95% confidence interval for the percentage of orders that are not accurate at Restaurant B: 0.174<p <0.266. What do you conclude? a. Construct a 95% confidence interval. Express the percentages in decimal form....
 In a study of the accuracy of fast food drive-through orders, Restaurant A had 299 accurate orders and 56 that were not accurate. a. Construct a 95% confidence interval estimate of the percentage of orders that are not accurate. b Compare the results from part a to this 95% confidence interval for the percentage of orders that are not accurate at Restaurant B: 0.137 p <0.214. What do you conclude? a. Construct a 95% confidence interval. Express the percentages in...
Most questions answered within 3 hours.
-
Where is the error in this code sequence?
String s1 = "Hello";
String s2 = "ello";...
asked 11 months ago -
Financial data for Joel de Paris, Inc., for last year
follow:
Joel de Paris, Inc.
Balance...
asked 11 months ago -
Consider this reaction:
Al2(SO4)3 (aq)+ BaCl3
(aq) Al2Cl6 (aq)- +
3BaSO4(s) . What is the...
asked 11 months ago -
Suppose that Savneet is considering increasing her
recent random sample from 20 car rentals to 40...
asked 11 months ago -
Trucks arrive at an unloading terminal at an average rate of 120
per hour.
Trucks arrive...
asked 11 months ago -
Why are methanol and ethanol completely soluble in water while
octanol is not very little soluble....
asked 11 months ago -
A facilities manager at a university reads in a research report
that the mean amount of...
asked 11 months ago -
When the CuSO4 is rehydrated by adding water to the anhydrous
compound, is this an endothermic...
asked 11 months ago -
A ray of sunlight is passing from diamond into crown glass; the
angle of incidence is...
asked 11 months ago -
A block of mass 0.249 kg is placed on top of a light, vertical
spring of...
asked 11 months ago -
how do the kidneys compensate in the presences of acidosis
a) trigger hyperventilate
b) reserve acid...
asked 11 months ago -
Question 501 pts
The rental rate of capital to the firm increases. Which of the
following...
asked 11 months ago