Compute and plot the average percent defective as well as the Upper and Lower Control Limits...
Compute and plot the average percent defective as well as the Upper and Lower Control Limits for the following data. You will need to compute the standard deviation as well. The number of samples collected in a month was 30. The number of items in each sample was 200. A total of 90 errors were found.
Homework Answers

Add Answer to:
Compute and plot the average percent defective as well as the
Upper and Lower Control Limits...
In a manufacturing operation, the percentage defective averages 2.5 percent and sample size in 200. Compute...
In a manufacturing operation, the percentage defective averages 2.5 percent and sample size in 200. Compute the center line for the p chart. Compute the 3 control limits for the chart (i.e., z-value = 3.0). Plot these recent data collected from daily samples and decide if the operation is in control: Number of defectives per sample = 2,9,7,5,0,3,8,7,2,5,3,2
a) What are the lower and upper control limits for this chart if these limits are...
 a) What are the lower and upper control limits for this chart if
these limits are chosen to be four standard deviations from
thetarget?
Upper Control Limit (UCL - subscript x) = _______ calories
(enter your response as an integer).
Lower Control Limit (LCL- subscript x) = ________calories
(enter your response as an integer).
b) What are the limits with three standard deviations from the
target?
The 3-sigma x overbarx chart control limitsare:
Upper Control Limit (UCL - subscript...
a) What are the lower and upper control limits for this chart if
these limits are chosen to be four standard deviations from
thetarget?
Upper Control Limit (UCL - subscript x) = _______ calories
(enter your response as an integer).
Lower Control Limit (LCL- subscript x) = ________calories
(enter your response as an integer).
b) What are the limits with three standard deviations from the
target?
The 3-sigma x overbarx chart control limitsare:
Upper Control Limit (UCL - subscript...
a production process is considered in control if up to 4% of items produced are defective. samples of size 100 are used for the inspection process. determine the upper and lower control limits for the...
a production process is considered in control if up to 4% of items produced are defective. samples of size 100 are used for the inspection process. determine the upper and lower control limits for the p chart. A. UCL= .0988 LCL=0.0000 B. UCL=.0888 LCL= 0.000 C. UCL= .0788 LCL= .01 D. UCL= 0.0688 LCL= .02
22. After 10 observations, what are the upper and lower control limits of an Exponentially Weighted...
 22. After 10 observations, what are the upper and lower control limits of an Exponentially Weighted Moving Average (EWMA) chart for = 0.10 and L = 3? The distance from the center line to either of the control limits (upper or lower) is taken to be Loy, where zi is the il EWMA. Take the target value of the mean of the quality characteristic to be 10 and the population standard deviation of the quality characteristic to be 2.
What are the upper and lower control limits? Answers rounded to 3 decimal places Five data entry operators work at the...
 What are the upper and lower control limits? Answers rounded to
3 decimal places
Five data entry operators work at the data processing department of the Birmingham Bank. Each day for 30 days, the number of defective records in a sample of 350 records typed by these operators has been noted, as follows. Sample No. DefectivesNo. Sample No. DefectivesNo 18 13 23 24 10 10 15 16 10 25 26 10 17 12 18 19 18 10 12 a) Establish...
What are the upper and lower control limits? Answers rounded to
3 decimal places
Five data entry operators work at the data processing department of the Birmingham Bank. Each day for 30 days, the number of defective records in a sample of 350 records typed by these operators has been noted, as follows. Sample No. DefectivesNo. Sample No. DefectivesNo 18 13 23 24 10 10 15 16 10 25 26 10 17 12 18 19 18 10 12 a) Establish...
Product filling weights are normally distributed with a mean of 365 grams and a standard deviation of 19 grams. a. Compute the chart upper control limit and lower control limit for this process if sa...
 Product filling weights are normally distributed with a mean of 365 grams and a standard deviation of 19 grams. a. Compute the chart upper control limit and lower control limit for this process if samples of size 10, 20 and 30 are used (to 2 decimals). Use Table 19.3. For samples of size 10 UCL =| LCL For a sample size of 20 UCL = LCL For a sample size of 30 UCL = LCL = b. What happens to...
Given a situation where a control chart with 3-sigma limits is being constructed to monitor the...
Given a situation where a control chart with 3-sigma limits is being constructed to monitor the percentage of defective items produced by a process, if samples of 100 units each are taken from the process and the average percent defective found in the first 10 samples is .06 (6%), what is the upper control limit (rounded to two decimal places) for the process A. .06 B. .13 C. .16 D. .18 E. .24
thanks! :) Formulas for Questions 24-27 Upper control in. UCL= 1 + 20 Lower control it....
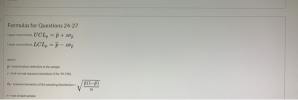 thanks! :)
Formulas for Questions 24-27 Upper control in. UCL= 1 + 20 Lower control it. LCL - P - 20% where p mean traction detective in the sample 2 of normal standard deviations for 99.73%) standard deviation of the sampling distribution /P(1-P) size of each sample size of each sample Table 2. A manufacturer of precision machine parts produces a specialty bracket. They inspected random samples with 70 brackets per sample a total of 600 brackets and checked each...
thanks! :)
Formulas for Questions 24-27 Upper control in. UCL= 1 + 20 Lower control it. LCL - P - 20% where p mean traction detective in the sample 2 of normal standard deviations for 99.73%) standard deviation of the sampling distribution /P(1-P) size of each sample size of each sample Table 2. A manufacturer of precision machine parts produces a specialty bracket. They inspected random samples with 70 brackets per sample a total of 600 brackets and checked each...
The upper and lower control limits on control charts are usually set at a distance of +/- three times the standard devia...
The upper and lower control limits on control charts are usually set at a distance of +/- three times the standard deviation from the center line of the control chart. Use independent research to find the reasons why. Make sure you use the concept of type I and type II error in your discussion. Under what circumstances might a manager consider the use of limits at two times the standard deviation. What should the manager keep in mind when setting...
Twenty samples of 100 items each were inspected when a process was considered to be operating...
Twenty samples of 100 items each were inspected when a process was considered to be operating satisfactorily. In the 20 samples, a total of 135 items were found to be defective. (a) What is an estimate of the proportion defective when the process is in control? (b) What is the standard error of the proportion if samples of size 100 will be used for statistical process control? (Round your answer to four decimal places.) (c)Compute the upper and lower control...
 a) What are the lower and upper control limits for this chart if
these limits are chosen to be four standard deviations from
thetarget?
Upper Control Limit (UCL - subscript x) = _______ calories
(enter your response as an integer).
Lower Control Limit (LCL- subscript x) = ________calories
(enter your response as an integer).
b) What are the limits with three standard deviations from the
target?
The 3-sigma x overbarx chart control limitsare:
Upper Control Limit (UCL - subscript...
a) What are the lower and upper control limits for this chart if
these limits are chosen to be four standard deviations from
thetarget?
Upper Control Limit (UCL - subscript x) = _______ calories
(enter your response as an integer).
Lower Control Limit (LCL- subscript x) = ________calories
(enter your response as an integer).
b) What are the limits with three standard deviations from the
target?
The 3-sigma x overbarx chart control limitsare:
Upper Control Limit (UCL - subscript...
 22. After 10 observations, what are the upper and lower control limits of an Exponentially Weighted Moving Average (EWMA) chart for = 0.10 and L = 3? The distance from the center line to either of the control limits (upper or lower) is taken to be Loy, where zi is the il EWMA. Take the target value of the mean of the quality characteristic to be 10 and the population standard deviation of the quality characteristic to be 2.
 What are the upper and lower control limits? Answers rounded to
3 decimal places
Five data entry operators work at the data processing department of the Birmingham Bank. Each day for 30 days, the number of defective records in a sample of 350 records typed by these operators has been noted, as follows. Sample No. DefectivesNo. Sample No. DefectivesNo 18 13 23 24 10 10 15 16 10 25 26 10 17 12 18 19 18 10 12 a) Establish...
What are the upper and lower control limits? Answers rounded to
3 decimal places
Five data entry operators work at the data processing department of the Birmingham Bank. Each day for 30 days, the number of defective records in a sample of 350 records typed by these operators has been noted, as follows. Sample No. DefectivesNo. Sample No. DefectivesNo 18 13 23 24 10 10 15 16 10 25 26 10 17 12 18 19 18 10 12 a) Establish...
 Product filling weights are normally distributed with a mean of 365 grams and a standard deviation of 19 grams. a. Compute the chart upper control limit and lower control limit for this process if samples of size 10, 20 and 30 are used (to 2 decimals). Use Table 19.3. For samples of size 10 UCL =| LCL For a sample size of 20 UCL = LCL For a sample size of 30 UCL = LCL = b. What happens to...
 thanks! :)
Formulas for Questions 24-27 Upper control in. UCL= 1 + 20 Lower control it. LCL - P - 20% where p mean traction detective in the sample 2 of normal standard deviations for 99.73%) standard deviation of the sampling distribution /P(1-P) size of each sample size of each sample Table 2. A manufacturer of precision machine parts produces a specialty bracket. They inspected random samples with 70 brackets per sample a total of 600 brackets and checked each...
thanks! :)
Formulas for Questions 24-27 Upper control in. UCL= 1 + 20 Lower control it. LCL - P - 20% where p mean traction detective in the sample 2 of normal standard deviations for 99.73%) standard deviation of the sampling distribution /P(1-P) size of each sample size of each sample Table 2. A manufacturer of precision machine parts produces a specialty bracket. They inspected random samples with 70 brackets per sample a total of 600 brackets and checked each...
Most questions answered within 3 hours.
-
Where is the error in this code sequence?
String s1 = "Hello";
String s2 = "ello";...
asked 11 months ago -
Financial data for Joel de Paris, Inc., for last year
follow:
Joel de Paris, Inc.
Balance...
asked 11 months ago -
Consider this reaction:
Al2(SO4)3 (aq)+ BaCl3
(aq) Al2Cl6 (aq)- +
3BaSO4(s) . What is the...
asked 11 months ago -
Suppose that Savneet is considering increasing her
recent random sample from 20 car rentals to 40...
asked 11 months ago -
Trucks arrive at an unloading terminal at an average rate of 120
per hour.
Trucks arrive...
asked 11 months ago -
Why are methanol and ethanol completely soluble in water while
octanol is not very little soluble....
asked 11 months ago -
A facilities manager at a university reads in a research report
that the mean amount of...
asked 11 months ago -
When the CuSO4 is rehydrated by adding water to the anhydrous
compound, is this an endothermic...
asked 11 months ago -
A ray of sunlight is passing from diamond into crown glass; the
angle of incidence is...
asked 11 months ago -
A block of mass 0.249 kg is placed on top of a light, vertical
spring of...
asked 11 months ago -
how do the kidneys compensate in the presences of acidosis
a) trigger hyperventilate
b) reserve acid...
asked 11 months ago -
Question 501 pts
The rental rate of capital to the firm increases. Which of the
following...
asked 11 months ago