Reaction time was observed for touchscreen interaction with a computer and haptic (e.g., button) interaction with...
Reaction time was observed for touchscreen interaction with a computer and haptic (e.g., button) interaction with a computer to identify if there was a difference in response times for the two technologies. Fifteen students used the touchscreen computers, and fifteen students used the haptic computers. The sample mean and standard deviation for the touchscreen computer was 4.7 and 4, respectively. The sample mean and standard deviation for the haptic computer was 7.8 and 6.25, respectively. Assume that the variances are equal between the populations. Test the hypothesis. Use a=0.05. What is the p-value?
Homework Answers
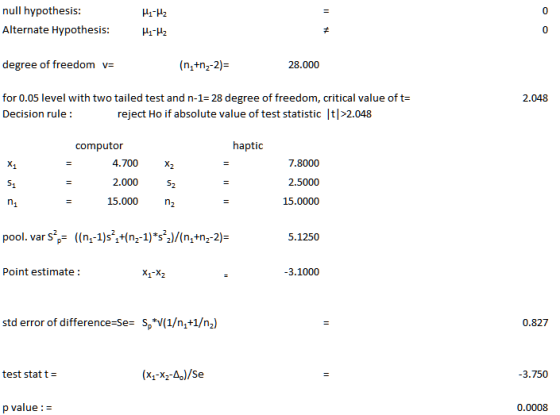
as p value is less than 0.05 level we reject null hypothesis and conclude that there is a difference in response times for the two technologies
Add Answer to:
Reaction time was observed for touchscreen interaction with a
computer and haptic (e.g., button) interaction with...
A study was designed to compare the attitudes of two groups of nursing students towards computers....
 A study was designed to compare the attitudes of two groups of nursing students towards computers. Group 1 had previously taken a statistical methods course that involved significant computer interaction. Group 2 had taken a statistic methods course that did not use computers. The students' attitudes were measured by administering the Computer Anxiety Rating Scale (CARS). A random sample of 15 nursing students from Group 1 resulted in a mean score of 41.5 with a standard deviation of 4.2. A...
A study was designed to compare the attitudes of two groups of nursing students towards computers....
A study was designed to compare the attitudes of two groups of nursing students towards computers. Group 1 had previously taken a statistical methods course that involved significant computer interaction. Group 2 had taken a statistic methods course that did not use computers. The students' attitudes were measured by administering the Computer Anxiety Rating Scale (CARS). A random sample of 15 nursing students from Group 1 resulted in a mean score of 66.5 with a standard deviation of 2.6. A...
A study was designed to compare the attitudes of two groups of nursing students towards computers....
A study was designed to compare the attitudes of two groups of nursing students towards computers. Group 1 had previously taken a statistical methods course that involved significant computer interaction. Group 2 had taken a statistic methods course that did not use computers. The students' attitudes were measured by administering the Computer Anxiety Rating Scale (CARS). A random sample of 16 nursing students from Group 1 resulted in a mean score of 55.4 with a standard deviation of 4.5 ....
A study was designed to compare the attitudes of two groups of nursing students towards computers....
A study was designed to compare the attitudes of two groups of nursing students towards computers. Group 1 had previously taken a statistical methods course that involved significant computer interaction. Group 2 had taken a statistic methods course that did not use computers. The students' attitudes were measured by administering the Computer Anxiety Rating Scale (CARS). A random sample of 18 nursing students from Group 1 resulted in a mean score of 44 with a standard deviation of 6.5. A...
A study was designed to compare the attitudes of two groups of nursing students towards computers. Group 1 had previousl...
A study was designed to compare the attitudes of two groups of nursing students towards computers. Group 1 had previously taken a statistical methods course that involved significant computer interaction. Group 2 had taken a statistic methods course that did not use computers. The students' attitudes were measured by administering the Computer Anxiety Rating Scale (CARS). A random sample of 16 nursing students from Group 1 resulted in a mean score of 41.3 with a standard deviation of 2.5. A...
A study was designed to compare the attitudes of two groups of nursing students towards computers....
A study was designed to compare the attitudes of two groups of nursing students towards computers. Group 1 had previously taken a statistical methods course that involved significant computer interaction. Group 2 had taken a statistic methods course that did not use computers. The students' attitudes were measured by administering the Computer Anxiety Rating Scale (CARS). A random sample of 11 nursing students from Group 1 resulted in a mean score of 49.8 with a standard deviation of 5.7. A...
A study was designed to compare the attitudes of two groups of nursing students towards computers....
A study was designed to compare the attitudes of two groups of nursing students towards computers. Group 1 had previously taken a statistical methods course that involved significant computer interaction. Group 2 had taken a statistic methods course that did not use computers. The students' attitudes were measured by administering the Computer Anxiety Rating Scale (CARS). A random sample of 1111 nursing students from Group 1 resulted in a mean score of 40.840.8 with a standard deviation of 5.45.4. A...
Question 3: Two sample hypothesis testing We want to investigate the diameter of steel rods that...
 Question 3: Two sample hypothesis testing We want to investigate the diameter of steel rods that are manufactured on two different sites. We pick two different random samples of sizes ni = n2 = 15. The sample means are X1 = 6.2, X2 = 7.8, respectively. The sample variances are sî = 4 and s2 = 6.25. Assume that both sites produce rods of diameter that is normally distributed with the same standard deviation 01 = 02. Answer the following...
We want to investigate the diameter of steel rods that are manufactured on two different sites....
 We want to investigate the diameter of steel rods that are
manufactured on two different sites. We pick two different random
samples of sizes n1 = n2 = 15. The sample means are X1 = 6.2, X2 =
7.8, respectively. The sample variances are s 2 1 = 4 and s 2 2 =
6.25. Assume that both sites produce rods of diameter that is
normally distributed with the same standard deviation σ1 = σ2.
Answer the following questions.
(a)...
We want to investigate the diameter of steel rods that are
manufactured on two different sites. We pick two different random
samples of sizes n1 = n2 = 15. The sample means are X1 = 6.2, X2 =
7.8, respectively. The sample variances are s 2 1 = 4 and s 2 2 =
6.25. Assume that both sites produce rods of diameter that is
normally distributed with the same standard deviation σ1 = σ2.
Answer the following questions.
(a)...
The university data center has two main computers. The center wants to examine whether computer 1...
 The university data center has two main computers. The center wants to examine whether computer 1 is receiving tasks that require processing times comparable to those of computer 2. A random sample of 9 processing times from computer I showed a mean of 52 seconds with a standard deviation of 19 seconds, while a random sample of 14 processing times from computer 2 (chosen independently of those for computer 1) showed a mean of 56 seconds with a standard deviation...
 A study was designed to compare the attitudes of two groups of nursing students towards computers. Group 1 had previously taken a statistical methods course that involved significant computer interaction. Group 2 had taken a statistic methods course that did not use computers. The students' attitudes were measured by administering the Computer Anxiety Rating Scale (CARS). A random sample of 15 nursing students from Group 1 resulted in a mean score of 41.5 with a standard deviation of 4.2. A...
 Question 3: Two sample hypothesis testing We want to investigate the diameter of steel rods that are manufactured on two different sites. We pick two different random samples of sizes ni = n2 = 15. The sample means are X1 = 6.2, X2 = 7.8, respectively. The sample variances are sî = 4 and s2 = 6.25. Assume that both sites produce rods of diameter that is normally distributed with the same standard deviation 01 = 02. Answer the following...
 We want to investigate the diameter of steel rods that are
manufactured on two different sites. We pick two different random
samples of sizes n1 = n2 = 15. The sample means are X1 = 6.2, X2 =
7.8, respectively. The sample variances are s 2 1 = 4 and s 2 2 =
6.25. Assume that both sites produce rods of diameter that is
normally distributed with the same standard deviation σ1 = σ2.
Answer the following questions.
(a)...
We want to investigate the diameter of steel rods that are
manufactured on two different sites. We pick two different random
samples of sizes n1 = n2 = 15. The sample means are X1 = 6.2, X2 =
7.8, respectively. The sample variances are s 2 1 = 4 and s 2 2 =
6.25. Assume that both sites produce rods of diameter that is
normally distributed with the same standard deviation σ1 = σ2.
Answer the following questions.
(a)...
 The university data center has two main computers. The center wants to examine whether computer 1 is receiving tasks that require processing times comparable to those of computer 2. A random sample of 9 processing times from computer I showed a mean of 52 seconds with a standard deviation of 19 seconds, while a random sample of 14 processing times from computer 2 (chosen independently of those for computer 1) showed a mean of 56 seconds with a standard deviation...
Most questions answered within 3 hours.
-
Where is the error in this code sequence?
String s1 = "Hello";
String s2 = "ello";...
asked 10 months ago -
Financial data for Joel de Paris, Inc., for last year
follow:
Joel de Paris, Inc.
Balance...
asked 10 months ago -
Consider this reaction:
Al2(SO4)3 (aq)+ BaCl3
(aq) Al2Cl6 (aq)- +
3BaSO4(s) . What is the...
asked 10 months ago -
Suppose that Savneet is considering increasing her
recent random sample from 20 car rentals to 40...
asked 10 months ago -
Trucks arrive at an unloading terminal at an average rate of 120
per hour.
Trucks arrive...
asked 10 months ago -
Why are methanol and ethanol completely soluble in water while
octanol is not very little soluble....
asked 10 months ago -
A facilities manager at a university reads in a research report
that the mean amount of...
asked 10 months ago -
When the CuSO4 is rehydrated by adding water to the anhydrous
compound, is this an endothermic...
asked 10 months ago -
A ray of sunlight is passing from diamond into crown glass; the
angle of incidence is...
asked 10 months ago -
A block of mass 0.249 kg is placed on top of a light, vertical
spring of...
asked 10 months ago -
how do the kidneys compensate in the presences of acidosis
a) trigger hyperventilate
b) reserve acid...
asked 10 months ago -
Question 501 pts
The rental rate of capital to the firm increases. Which of the
following...
asked 10 months ago