At a certain hotel, guests have come from the following locations: Use Table 3. Category North...
|
At a certain hotel, guests have come from the following locations: Use Table 3. |
| Category | North America | Asia | Other | TOTAL |
| Proportion | 60 | 30 | 10 | 100 |
| Category | North America | Asia | Other |
| Frequency | 238 | 107 | 45 |
| a. | Choose the appropriate alternative hypothesis at H0: p1 = 0.60, p2 = 0.30, and p3 = 0.10. |
|
| b. |
Calculate the value of the test statistic at H0: p1 = 0.60, p2 = 0.30, and p3 = 0.10. (Round intermediate calculations to at least 4 decimal places and final answer to 2 decimal places.) |
| Test statistic |
| c. | Approximate the p-value. |
|
| d. | At 5% significance level, can we reject H0: p1 = 0.60, p2 = 0.30, and p3 = 0.10? |
|
NEED DONE IN 30 TIMED HW
Homework Answers
a)
Null hypothesis H0 : p1 = 0.60, p2 = 0.30, and p3 = 0.10
Alternative hypothesis H1 : At least one of the population proportions differs from its hypothesized value.
b)
Test statistic :

Where, Oi is observed frequency.
Ei is Expected frequency.
Ei = N*Pi
Calculation :
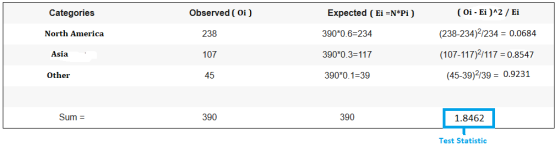
Test Statistic = 1.85
c ) P-value :
Using Excel function , =CHIDIST( x , df )
df = 3 - 1 = 2 , x = test statistic
P-value = CHIDIST( 1.85 , 2 ) = 0.3965
i.e p-value > 0.100
d )
Decision about null hypothesis -
Rule : Reject null hypothesis if p-value less than significance level
Significance level =  = 5% = 0.05
It is observed that p-value is greater than significance level
= 0.05
fail to reject null hypothesis.
Correct option : No since the p-value is more than α.
Add Answer to:
At a certain hotel, guests have come from the following
locations: Use Table 3.
Category
North...
A multinomial experiment produced the following results: (You may find it useful to reference the appropriate...
 A multinomial experiment produced the following results:
(You may find it useful to reference the appropriate table:
chi-square table or F table)
Category
1
2
3
Frequency
117
100
83
a. Choose the appropriate alternative
hypothesis at H0: p1 =
0.50, p2 = 0.30, and p3 =
0.20.
All population proportions differ from their hypothesized
values.
At least one of the population proportions differs from its
hypothesized value.
b. Calculate the value of the test statistic.
(Round intermediate calculations to...
A multinomial experiment produced the following results:
(You may find it useful to reference the appropriate table:
chi-square table or F table)
Category
1
2
3
Frequency
117
100
83
a. Choose the appropriate alternative
hypothesis at H0: p1 =
0.50, p2 = 0.30, and p3 =
0.20.
All population proportions differ from their hypothesized
values.
At least one of the population proportions differs from its
hypothesized value.
b. Calculate the value of the test statistic.
(Round intermediate calculations to...
Consider the following competing hypotheses and accompanying sample data. (You may find it useful to reference...
Consider the following competing hypotheses and accompanying sample data. (You may find it useful to reference the appropriate table: z table or t table) H0: p1 − p2 ≥ 0 HA: p1 − p2 < 0 x1 = 250 x2 = 275 n1 = 400 n2 = 400 a. Calculate the value of the test statistic. (Negative value should be indicated by a minus sign. Round intermediate calculations to at least 4 decimal places and final answer to 2 decimal...
Consider a multinomial experiment with n = 260 and k = 4. The null hypothesis to...
Consider a multinomial experiment with n = 260 and k = 4. The null hypothesis to be tested is H0: p1 = p2 = p3 = p4 = 0.25. The observed frequencies resulting from the experiment are: (You may find it useful to reference the appropriate table: chi-square table or F table) Category 1 2 3 4 Frequency 73 44 75 68 a. Choose the appropriate alternative hypothesis. All population proportions differ from 0.25. Not all population proportions are equal...
In order to conduct a hypothesis test of the population mean, a random sample of 28 observations is drawn from a nor...
In order to conduct a hypothesis test of the population mean, a random sample of 28 observations is drawn from a normally distributed population. The resulting mean and the standard deviation are calculated as 17.9 and 1.5, respectively. Use Table 2. Use the p-value approach to conduct the following tests at α = 0.10. H0: μ ≤ 17.5 against HA: μ > 17.5 a-1. Calculate the value of the test statistic. (Round your intermediate calculations to 4 decimal places and...
You suspect that an unscrupulous employee at a casino has tampered with a die; that is,...
 You suspect that an unscrupulous employee at a casino has tampered with a die; that is, he is using a loaded die. In order to test this claim, you roll the die 294 times and obtain the following frequencies: 2 58 3 57 4 40 54 54 31 (Use Table 3) Click here for the Excel Data File a. Choose the appropriate alternative hypothesis to test if the population proportions differ Not all population proportions are equal to 1/6 All...
Consider the following competing hypotheses and accompanying sample data drawn independently from normally distributed populations. (You may find it useful to reference the appropriate table: z table or t table)
 Consider the following competing hypotheses and accompanying sample data drawn independently from normally distributed populations. (You may find it useful to reference the appropriate table: z table or t table) H0: μ1 − μ2 ≥ 0HA: μ1 − μ2 < 0 x¯1x¯1= 249x−2x−2= 262s1 = 35s2 = 23n1 = 10n2 = 10a-1. Calculate the value of the test statistic under the assumption that the population variances are equal. (Negative values should be indicated by a minus sign. Round all intermediate calculations to at least 4 decimal places and final answer to 3 decimal places.) a-2. Find the p-value. multiple choice 1p-value < 0.010.01 ≤ p-value...
The Fish and Game Department stocked a lake with fish in the following proportions: 30% catfish,...
The Fish and Game Department stocked a lake with fish in the following proportions: 30% catfish, 15% bass, 40% bluegill, and 15% pike. Five years later it sampled the lake to see if the distribution of fish had changed. It found that the 500 fish in the sample were distributed as follows. Catfish Bass Bluegill Pike 112 91 224 73 In the 5-year interval, did the distribution of fish change at the 0.05 level? (i) State the null and alternate...
Birds use color to select and avoid certain types of food. The authors of a particular...
 Birds use color to select and avoid certain
types of food. The authors of a particular article studied the
pecking behavior of 1-day-old bobwhites. In an area painted white,
they inserted four pins with different colored heads. The color of
the pin chosen on the bird's first peck was noted for each of 33
bobwhites, resulting in the accompanying table. Color First Peck
Frequency Blue 15 Green 8 Yellow 7 Red 3 Do these data provide
evidence of a color...
Birds use color to select and avoid certain
types of food. The authors of a particular article studied the
pecking behavior of 1-day-old bobwhites. In an area painted white,
they inserted four pins with different colored heads. The color of
the pin chosen on the bird's first peck was noted for each of 33
bobwhites, resulting in the accompanying table. Color First Peck
Frequency Blue 15 Green 8 Yellow 7 Red 3 Do these data provide
evidence of a color...
Random samples of two species of iris gave the following petal lengths (in cm). x1, Iris virginica 5.1 5.9 4.5 4.9 5.7 4.8 5.8 6.4 5.7 5.9 x2, Iris versicolor 4.5 4.3 4.7 5.0 3.8 5.1 4.4 4.2 (a) Use a...
Random samples of two species of iris gave the following petal lengths (in cm). x1, Iris virginica 5.1 5.9 4.5 4.9 5.7 4.8 5.8 6.4 5.7 5.9 x2, Iris versicolor 4.5 4.3 4.7 5.0 3.8 5.1 4.4 4.2 (a) Use a 5% level of significance to test the claim that the population standard deviation of x1 is larger than 0.55. What is the level of significance? State the null and alternate hypotheses. H0: σ = 0.55; H1: σ > 0.55...
You may need to use the appropriate technology to answer this question. Use the sample data...
 You may need to use the appropriate technology to answer this question. Use the sample data below to test the hypotheses H0: p1 = p2= p3 Ha: not all population proportions are equal where p is the population proportion of Yes responses for population i. Populations Response 1 2 3 155 140 101 Yes No 105 140 109 Find the value of the test statistic. (Round your answer to three decimal places.) Find the p-value. (Round your answer to four...
 A multinomial experiment produced the following results:
(You may find it useful to reference the appropriate table:
chi-square table or F table)
Category
1
2
3
Frequency
117
100
83
a. Choose the appropriate alternative
hypothesis at H0: p1 =
0.50, p2 = 0.30, and p3 =
0.20.
All population proportions differ from their hypothesized
values.
At least one of the population proportions differs from its
hypothesized value.
b. Calculate the value of the test statistic.
(Round intermediate calculations to...
A multinomial experiment produced the following results:
(You may find it useful to reference the appropriate table:
chi-square table or F table)
Category
1
2
3
Frequency
117
100
83
a. Choose the appropriate alternative
hypothesis at H0: p1 =
0.50, p2 = 0.30, and p3 =
0.20.
All population proportions differ from their hypothesized
values.
At least one of the population proportions differs from its
hypothesized value.
b. Calculate the value of the test statistic.
(Round intermediate calculations to...
 You suspect that an unscrupulous employee at a casino has tampered with a die; that is, he is using a loaded die. In order to test this claim, you roll the die 294 times and obtain the following frequencies: 2 58 3 57 4 40 54 54 31 (Use Table 3) Click here for the Excel Data File a. Choose the appropriate alternative hypothesis to test if the population proportions differ Not all population proportions are equal to 1/6 All...
 Birds use color to select and avoid certain
types of food. The authors of a particular article studied the
pecking behavior of 1-day-old bobwhites. In an area painted white,
they inserted four pins with different colored heads. The color of
the pin chosen on the bird's first peck was noted for each of 33
bobwhites, resulting in the accompanying table. Color First Peck
Frequency Blue 15 Green 8 Yellow 7 Red 3 Do these data provide
evidence of a color...
Birds use color to select and avoid certain
types of food. The authors of a particular article studied the
pecking behavior of 1-day-old bobwhites. In an area painted white,
they inserted four pins with different colored heads. The color of
the pin chosen on the bird's first peck was noted for each of 33
bobwhites, resulting in the accompanying table. Color First Peck
Frequency Blue 15 Green 8 Yellow 7 Red 3 Do these data provide
evidence of a color...
 You may need to use the appropriate technology to answer this question. Use the sample data below to test the hypotheses H0: p1 = p2= p3 Ha: not all population proportions are equal where p is the population proportion of Yes responses for population i. Populations Response 1 2 3 155 140 101 Yes No 105 140 109 Find the value of the test statistic. (Round your answer to three decimal places.) Find the p-value. (Round your answer to four...
Most questions answered within 3 hours.
-
Where is the error in this code sequence?
String s1 = "Hello";
String s2 = "ello";...
asked 10 months ago -
Financial data for Joel de Paris, Inc., for last year
follow:
Joel de Paris, Inc.
Balance...
asked 10 months ago -
Consider this reaction:
Al2(SO4)3 (aq)+ BaCl3
(aq) Al2Cl6 (aq)- +
3BaSO4(s) . What is the...
asked 10 months ago -
Suppose that Savneet is considering increasing her
recent random sample from 20 car rentals to 40...
asked 10 months ago -
Trucks arrive at an unloading terminal at an average rate of 120
per hour.
Trucks arrive...
asked 10 months ago -
Why are methanol and ethanol completely soluble in water while
octanol is not very little soluble....
asked 10 months ago -
A facilities manager at a university reads in a research report
that the mean amount of...
asked 10 months ago -
When the CuSO4 is rehydrated by adding water to the anhydrous
compound, is this an endothermic...
asked 10 months ago -
A ray of sunlight is passing from diamond into crown glass; the
angle of incidence is...
asked 10 months ago -
A block of mass 0.249 kg is placed on top of a light, vertical
spring of...
asked 10 months ago -
how do the kidneys compensate in the presences of acidosis
a) trigger hyperventilate
b) reserve acid...
asked 10 months ago -
Question 501 pts
The rental rate of capital to the firm increases. Which of the
following...
asked 10 months ago