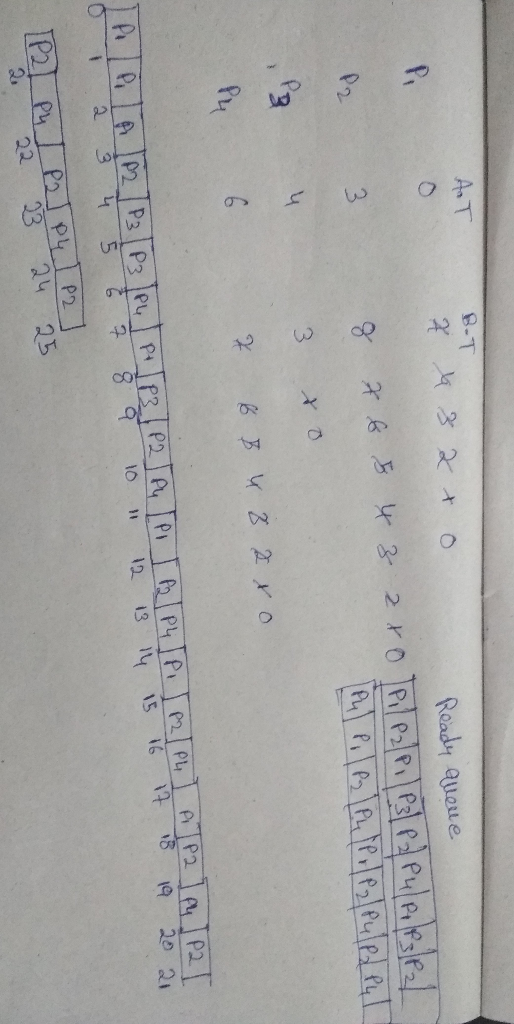
Process Arrival Time CPU Burst Time P1 0 7 P2 3 8 P3 4 3 P4...
|
Process |
Arrival Time |
CPU Burst Time |
|
P1 |
0 |
7 |
|
P2 |
3 |
8 |
|
P3 |
4 |
3 |
|
P4 |
6 |
7 |
For the following algorithms, calculate the average wait time and turn around time.
Round-robin with quantum of one time-unit
Homework Answers
| process | Arrival Time | CPU Burst Time | completion Time | TURN AROUND TIME | WAITING TIME |
| P1 | 0 | 7 | 18 | 18 | 11 |
| P2 | 3 | 8 | 25 | 22 | 14 |
| P3 | 4 | 3 | 9 | 5 | 2 |
| P4 | 6 | 7 | 24 | 19 | 13 |
TURN AROUND TIME=completion time - Arrival time
WAITING TIME= turn around time -Burst Time
completion time as we can see in below picture
Round robin is a time slot or quantum and the interrupting the job if it is not completed by then the job come will come into ready state after the other job which are arrived in the quantum time that make these scheduling

18+22+5+19/4
TAT =16
11+14+2+13/4
WT=10
| process | Arrival Time | CPU Burst Time | completion Time | TURN AROUND TIME | WAITING TIME |
| P1 | 0 | 7 | 18 | 18 | 11 |
| P2 | 3 | 8 | 25 | 22 | 14 |
| P3 | 4 | 3 | 9 | 5 | 2 |
| P4 | 6 | 7 | 24 | 19 | 13 |
TURN AROUND TIME=completion time - Arrival time
WAITING TIME= turn around time -Burst Time
completion time as we can see in below picture
Round robin is a time slot or quantum and the interrupting the job if it is not completed by then the job come will come into ready state after the other job which are arrived in the quantum time that make these scheduling
18+22+5+19/4
TAT =16
11+14+2+13/4
WT=10
V. Round Robin and SJF comparison 6 Process Arrival Time CPU Burst Time P1 0 9...
 V. Round Robin and SJF comparison 6 Process Arrival Time CPU Burst Time P1 0 9 P2 4 4 P3 6 P4 For each of the following algorithms, draw a Gantt chart and calculate the average wait time and turn around time. 1. Round robin with quantum=1 time unit 2. Round-robin with quantum=3 time-units 3. SJF WI preemption (Shortest Remaining Time First), assume quantum=3 4. SJE Wlo preemption 5. ECES
CPU scheduling Process Arrival Time Burst Time Priority P1 0 8 8 P2 0 4 10...
CPU scheduling Process Arrival Time Burst Time Priority P1 0 8 8 P2 0 4 10 P3 4 1 6 P4 6 6 8 For Shortest Remaining Time draw the Gantt chart to illustrate how these processes would be scheduled, and calculate turnaround time per process and the wait time per process.
Burst Time Arrival Time P1 54 2 P2 12 3 P3 26 4 P4 16 5...
Burst Time Arrival Time P1 54 2 P2 12 3 P3 26 4 P4 16 5 P5 8 6 P6 92 7 use SRTF (1) Gant chart (2) Waiting time and Turn around time for every process (3) Average WT and Average TAT
4. Consider a ready queue with four processes :- Process Arrival Time Burst Time (ms) P1...
 4. Consider a ready queue with four processes :- Process Arrival Time Burst Time (ms) P1 Priority P2 P3 P4 P5 For each of the following CPU scheduling algorithms, determine the turnaround and average waiting time for each of the process :- a. Shortest remaining Time First b. Shortest Job First C. Priority Scheduling (Both pre-emptive and non-preemptive) d. Round Robin (quantum is 1 ms)
process Arrival Time Burst Time P1 0 10 P2 2 7 P3 4 4 P4 5...
process Arrival Time Burst Time P1 0 10 P2 2 7 P3 4 4 P4 5 2 P5 6 1 I need the solution on non-preemptive SJF & Preemptive SJF the Gantt Chart , Wating time and Average Wating time becouse I am really confused :(
Q.2] Answer the following questions Process Burst Time Priority P1 3 1 P2 8 3 P3...
Q.2] Answer the following questions Process Burst Time Priority P1 3 1 P2 8 3 P3 2 4 P4 4 5 P5 5 1 (21 points) Consider the set of processes shown in the table above, with the length of the CPU-burst time given in milliseconds. The processes are assumed to have arrived in the order P5, P4, P3, P2 , and P1, all approximately at time 0. Draw three Gantt charts illustrating the execution of these processes using SJF,...
Given the following set of processes---with the specified length of the CPU burst, arrival time, and...
Given the following set of processes---with the specified length of the CPU burst, arrival time, and priority---compute response time for P1-P5 with round-robin scheduling with time quantum of 10 units. Also compute average response time. Assume that a newly arriving process arrives first at time T- and a process that is preempted due to the completion of its quantum arrives at time T+ in the waiting queue. (Note: Show the Gantt chart and other working details in your worksheet.) Process...
Part 2 Round Robin Scheduling Process Burst Time in Ms P1 4 P2 2 P3 1...
Part 2 Round Robin Scheduling Process Burst Time in Ms P1 4 P2 2 P3 1 Calculate the average waiting time and turnaround time using round robin scheduling, where the time quantum q = 2 ms According to the Round Robin algorithm, the arrival of processes is shown in the following Gantt chart. P1 P2 P3 P1 P2 P3 P1 P2 P3 P1 0 2 4 6 8 10 12 14 15 16 18...
Five processes p1,p2,p3,p4,p5 arrive at time 0 simultaneously. their cpu burst are 12,6,5,6, and 8 respectively....
Five processes p1,p2,p3,p4,p5 arrive at time 0 simultaneously. their cpu burst are 12,6,5,6, and 8 respectively. 1.) Uses Shortest job first to calculate the waiting time of each process b.) calculate the average waiting time
Answer the following using the processes and their corresponding arrival time and burst time. These processes...
Answer the following using the processes and their corresponding arrival time and burst time. These processes are being scheduled using a preemptive, round-robin scheduling algorithm with a time quantum of 2 units. PID Arrival Time Burst Time P1 0 4 P2 1 5 P3 2 3 P4 3 2 P5 4 6 1. Use a Gantt chart to represent the above processes (5 points) 2. Calculate the average waiting time for each process (5 points) 3. Calculate the completion time...
 V. Round Robin and SJF comparison 6 Process Arrival Time CPU Burst Time P1 0 9 P2 4 4 P3 6 P4 For each of the following algorithms, draw a Gantt chart and calculate the average wait time and turn around time. 1. Round robin with quantum=1 time unit 2. Round-robin with quantum=3 time-units 3. SJF WI preemption (Shortest Remaining Time First), assume quantum=3 4. SJE Wlo preemption 5. ECES
 4. Consider a ready queue with four processes :- Process Arrival Time Burst Time (ms) P1 Priority P2 P3 P4 P5 For each of the following CPU scheduling algorithms, determine the turnaround and average waiting time for each of the process :- a. Shortest remaining Time First b. Shortest Job First C. Priority Scheduling (Both pre-emptive and non-preemptive) d. Round Robin (quantum is 1 ms)
Most questions answered within 3 hours.
-
Where is the error in this code sequence?
String s1 = "Hello";
String s2 = "ello";...
asked 10 months ago -
Financial data for Joel de Paris, Inc., for last year
follow:
Joel de Paris, Inc.
Balance...
asked 10 months ago -
Consider this reaction:
Al2(SO4)3 (aq)+ BaCl3
(aq) Al2Cl6 (aq)- +
3BaSO4(s) . What is the...
asked 10 months ago -
Suppose that Savneet is considering increasing her
recent random sample from 20 car rentals to 40...
asked 10 months ago -
Trucks arrive at an unloading terminal at an average rate of 120
per hour.
Trucks arrive...
asked 10 months ago -
Why are methanol and ethanol completely soluble in water while
octanol is not very little soluble....
asked 10 months ago -
A facilities manager at a university reads in a research report
that the mean amount of...
asked 10 months ago -
When the CuSO4 is rehydrated by adding water to the anhydrous
compound, is this an endothermic...
asked 10 months ago -
A ray of sunlight is passing from diamond into crown glass; the
angle of incidence is...
asked 10 months ago -
A block of mass 0.249 kg is placed on top of a light, vertical
spring of...
asked 10 months ago -
how do the kidneys compensate in the presences of acidosis
a) trigger hyperventilate
b) reserve acid...
asked 10 months ago -
Question 501 pts
The rental rate of capital to the firm increases. Which of the
following...
asked 10 months ago