Smith and Johnson Industries has decided to use a p-Chart with 3-sigma control limits to monitor...
Smith and Johnson Industries has decided to use a p-Chart with 3-sigma control limits to monitor the proportion of defective galvanized pipes produced by their production process. The quality control manager randomly samples 150 galvanized pipes at 16 successively selected time periods and counts the number of defective galvanized pipes in the sample.
Step 1 of 8: What is the Center Line of the control chart? Round your answer to three decimal places.
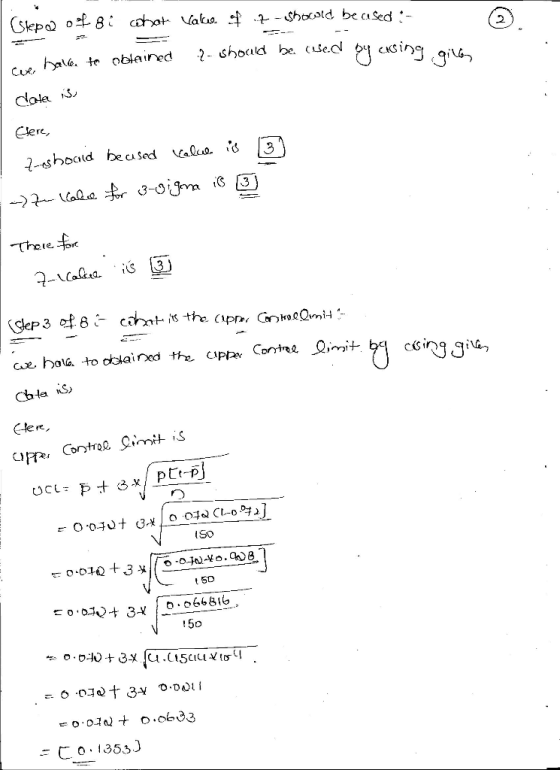
Step 2 of 8: What value of z should be used to construct the control chart?
Step 3 of 8: What is the Upper Control Limit? Round your answer to three decimal places
Step 4 of 8: What is the Lower Control Limit? Round your answer to three decimal places.
Step 5 of 8: At the next time period, 150 galvanized pipes are sampled and 7 defective galvanized pipes are detected.
Step 6 of 8: At the next time period, 150 galvanized pipes are sampled and 18 defective galvanized pipes are detected.
Step 7 of 8: At the next time period, 150 galvanized pipes are sampled and 29 defective galvanized pipes are detected.
Step 8 of 8: You, acting as the quality control manager, have concluded that the process is "Out of Control". What is the probability that the process is really "In Control" and you have made a Type I Error? Round your answer to three decimal places.
defects, 11,12,9,14,7,14,9,7,12,8,10,9,10,12,14,14
Homework Answers


 Due to insufficient time , i
will not answer(8) bit .
Due to insufficient time , i
will not answer(8) bit .
please send the separate question , i will answer it .
Thank you!
Add Answer to:
Smith and Johnson Industries has decided to use a p-Chart with
3-sigma control limits to monitor...
Judy Holmes Industries has decided to use a p-Chart to monitor the proportion of defective castings produced by their production process. The control limits on these charts will be designed to include...
Judy Holmes Industries has decided to use a p-Chart to monitor the proportion of defective castings produced by their production process. The control limits on these charts will be designed to include 95%95% of the sample proportions when the process is In Control. The operations manager randomly samples 400400 castings at 1616 successively selected time periods and counts the number of defective castings in the sample. Table Control Chart Copy Table Step 8 of 8 : You, acting as the...
The J H group's assembly unit has decided to use a p-Chart to monitor the proportion...
The J H group's assembly unit has decided to use a p-Chart to monitor the proportion of defective castings produced by their production process. The control limits on these charts will be designed to include 97% of the sample proportions when the process is In Control. The quality control manager randomly samples 200 castings at 10 successively selected time periods and counts the number of defective castings in the sample. Sample Defects 1...............7 2...............12 3...............8 4...............14 5...............8 6...............9 7...............8 8...............8...
Upper Control Limit pchart
William Industries has decided to use a p-chart with 3-sigma control limits to monitor the proportion of defective galvanized pipes produced by their production process. The operations manager randomly samples 250 galvanized pipes at 10 successivley selected time periods and counts the number of defective galvanized pipes in the sample. What is the Upper Control Limit?
Given a situation where a control chart with 3-sigma limits is being constructed to monitor the...
Given a situation where a control chart with 3-sigma limits is being constructed to monitor the percentage of defective items produced by a process, if samples of 100 units each are taken from the process and the average percent defective found in the first 10 samples is .06 (6%), what is the upper control limit (rounded to two decimal places) for the process A. .06 B. .13 C. .16 D. .18 E. .24
Refer to Table 56.1 - Factors for Computing Control Chart Limits (3 sigma) for this problem....
 Refer to Table 56.1 - Factors for Computing Control Chart Limits (3 sigma) for this problem. Thirty-five samples of size 7 each were taken from a fertilizer-bag-filling machine at Panos Kouvelis Lifelong Lawn Ltd. The results were: Overall mean = 60.75 lb.: Average range R = 1.78 lb. a) For the given sample size, the controllimits for 3-sigma x chart are: Upper Control Limit (UCL)- b. (round your response to three decimal places). Lower Control Limit (LCL:) - (round your...
Refer to Table 56.1 - Factors for Computing Control Chart Limits (3 sigma) for this problem....
 Refer to Table 56.1 - Factors for Computing Control Chart Limits (3 sigma) for this problem. Thirty-five samples of size 7 each were taken from a fertilizer-bag-filing machine at Panos Kouvelis Lifelong Lawn Ltd. The results were: Overall mean = 54.75 16.; Average range R = 1.84 6. a) For the given sample size, the control limits for 3-sigma x chart are: Upper Control Limit (UCL) - b. (round your response to three decimal places). Lower Control Limit (LL)-11. round...
Refer to Table S6.1 - Factors for Computing Control Chart Limits (3 sigma)LOADING... for this problem....
Refer to Table S6.1 - Factors for Computing Control Chart Limits (3 sigma)LOADING... for this problem. Twelve samples, each containing five parts, were taken from a process that produces steel rods at Emmanual Kodzi's factory. The length of each rod in the samples was determined. The results were tabulated and sample means and ranges were computed. The results were: Sample Sample Mean (in.) Range (in.) Sample Sample Mean (in.) Range (in.) 1 8.502 0.033 7 8.503 0.041 2 8.502 0.041...
Refer to Table 56.1 - Factors for Computing Control Chart Limits (sigma) for this problem. Thirty-five...
 Refer to Table 56.1 - Factors for Computing Control Chart Limits (sigma) for this problem. Thirty-five samples of size 7 each were taken from a fertilizer-bag-filling machine at Panos Kouvels Lifelong Lawn Lid. The results were: Overal mean = 54.75 lb.: Average range R 164 b. a) For the given sample size, the control limits for 3-sigma x chart are Upper Control Limit (UCL) - D. (round your response to three decimal places). Lower Control Limit (LCL)-1. (round your response...
step 2-what is the upper control limit? round to three decimal places step 3- what is the lower control limit? round to three decimal places step 4- use the following sample data, taken from the...
 step 2-what is the upper control limit? round to three decimal
places
step 3- what is the lower control limit? round to three
decimal places
step 4- use the following sample data, taken from the next
time period, to deteemine if the process “in control” or “out of
control”
observations:12.99,12.98,13.04,13.04,12.98
sample mean: 13.006
step 5:use the following sample data, taken from the next time
period, to deteemine if the process “in control” or “out of
control”
observations: 13,12.98,12.97,12.95,13.04
sample mean:...
step 2-what is the upper control limit? round to three decimal
places
step 3- what is the lower control limit? round to three
decimal places
step 4- use the following sample data, taken from the next
time period, to deteemine if the process “in control” or “out of
control”
observations:12.99,12.98,13.04,13.04,12.98
sample mean: 13.006
step 5:use the following sample data, taken from the next time
period, to deteemine if the process “in control” or “out of
control”
observations: 13,12.98,12.97,12.95,13.04
sample mean:...
Problems 3-5 (1pt each) a toy factory and need a 3-sigma X control chart to monitor the amount of...
 Problems 3-5 (1pt each) a toy factory and need a 3-sigma X control chart to monitor the amount of red dye irn dye follows a normal distribution. When the -6.3. They their red paint used on their fire trucks. The amount of red process is in control, the mean and standard deviation amount of red dye are μ have the following data: 36 and σ Sample Mean Sample Dye Measurements 32, 38, 35 34, 39, 31 Time Period 25,24,19 3....
 Refer to Table 56.1 - Factors for Computing Control Chart Limits (3 sigma) for this problem. Thirty-five samples of size 7 each were taken from a fertilizer-bag-filling machine at Panos Kouvelis Lifelong Lawn Ltd. The results were: Overall mean = 60.75 lb.: Average range R = 1.78 lb. a) For the given sample size, the controllimits for 3-sigma x chart are: Upper Control Limit (UCL)- b. (round your response to three decimal places). Lower Control Limit (LCL:) - (round your...
 Refer to Table 56.1 - Factors for Computing Control Chart Limits (3 sigma) for this problem. Thirty-five samples of size 7 each were taken from a fertilizer-bag-filing machine at Panos Kouvelis Lifelong Lawn Ltd. The results were: Overall mean = 54.75 16.; Average range R = 1.84 6. a) For the given sample size, the control limits for 3-sigma x chart are: Upper Control Limit (UCL) - b. (round your response to three decimal places). Lower Control Limit (LL)-11. round...
 Refer to Table 56.1 - Factors for Computing Control Chart Limits (sigma) for this problem. Thirty-five samples of size 7 each were taken from a fertilizer-bag-filling machine at Panos Kouvels Lifelong Lawn Lid. The results were: Overal mean = 54.75 lb.: Average range R 164 b. a) For the given sample size, the control limits for 3-sigma x chart are Upper Control Limit (UCL) - D. (round your response to three decimal places). Lower Control Limit (LCL)-1. (round your response...
 step 2-what is the upper control limit? round to three decimal
places
step 3- what is the lower control limit? round to three
decimal places
step 4- use the following sample data, taken from the next
time period, to deteemine if the process “in control” or “out of
control”
observations:12.99,12.98,13.04,13.04,12.98
sample mean: 13.006
step 5:use the following sample data, taken from the next time
period, to deteemine if the process “in control” or “out of
control”
observations: 13,12.98,12.97,12.95,13.04
sample mean:...
step 2-what is the upper control limit? round to three decimal
places
step 3- what is the lower control limit? round to three
decimal places
step 4- use the following sample data, taken from the next
time period, to deteemine if the process “in control” or “out of
control”
observations:12.99,12.98,13.04,13.04,12.98
sample mean: 13.006
step 5:use the following sample data, taken from the next time
period, to deteemine if the process “in control” or “out of
control”
observations: 13,12.98,12.97,12.95,13.04
sample mean:...
 Problems 3-5 (1pt each) a toy factory and need a 3-sigma X control chart to monitor the amount of red dye irn dye follows a normal distribution. When the -6.3. They their red paint used on their fire trucks. The amount of red process is in control, the mean and standard deviation amount of red dye are μ have the following data: 36 and σ Sample Mean Sample Dye Measurements 32, 38, 35 34, 39, 31 Time Period 25,24,19 3....
Most questions answered within 3 hours.
-
Where is the error in this code sequence?
String s1 = "Hello";
String s2 = "ello";...
asked 10 months ago -
Financial data for Joel de Paris, Inc., for last year
follow:
Joel de Paris, Inc.
Balance...
asked 10 months ago -
Consider this reaction:
Al2(SO4)3 (aq)+ BaCl3
(aq) Al2Cl6 (aq)- +
3BaSO4(s) . What is the...
asked 10 months ago -
Suppose that Savneet is considering increasing her
recent random sample from 20 car rentals to 40...
asked 10 months ago -
Trucks arrive at an unloading terminal at an average rate of 120
per hour.
Trucks arrive...
asked 10 months ago -
Why are methanol and ethanol completely soluble in water while
octanol is not very little soluble....
asked 10 months ago -
A facilities manager at a university reads in a research report
that the mean amount of...
asked 10 months ago -
When the CuSO4 is rehydrated by adding water to the anhydrous
compound, is this an endothermic...
asked 10 months ago -
A ray of sunlight is passing from diamond into crown glass; the
angle of incidence is...
asked 10 months ago -
A block of mass 0.249 kg is placed on top of a light, vertical
spring of...
asked 10 months ago -
how do the kidneys compensate in the presences of acidosis
a) trigger hyperventilate
b) reserve acid...
asked 10 months ago -
Question 501 pts
The rental rate of capital to the firm increases. Which of the
following...
asked 10 months ago