Construct a pivot table (frequency table) of the data from Manufacturing Example xlsx What is the...
Homework Answers
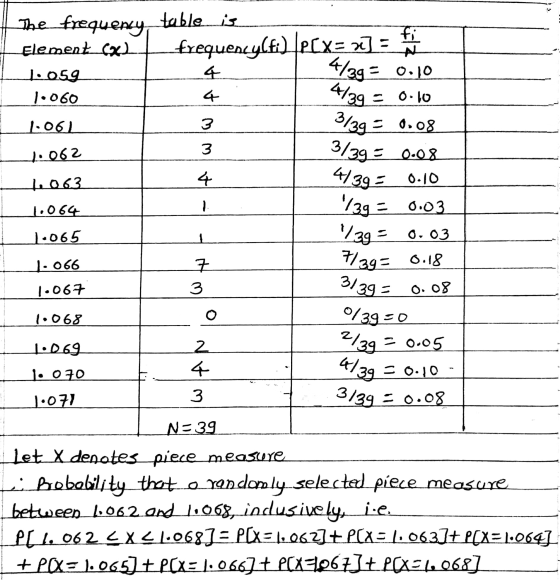
The probability that a randomly selected piece measures between 1.062 & 1.068, inclusively is 0.49

Add Answer to:
Construct a pivot table (frequency table) of the data from
Manufacturing Example xlsx
What is the...
Construct a pivot table (frequency table) of the data from Manufacturing Example xlsx What is the...
Construct a pivot table (frequency table) of the data from Manufacturing Example xlsx What is the probability that a randomly selected piece measures exactly 1.062? Round to 2 decimals (ie, 0.04) Inspection Data L1 1.062 1.066 1.066 1.06 1.066 1.066 1.06 1.059 1.067 1.064 1.066 1.063 1.06 1.06 1.067 1.065 1.059 1.066 1.07 1.063 1.062 1.071 1.061 1.061 1.071 1.066 1.063 1.07 1.069 1.059 1.059 1.067 1.063 1.062 1.07 1.061 1.07 1.069 1.071
T Distribution Table The U.S. Dairy Industry wants to estimate the mean yearly milk consumption. A...
 T Distribution Table
The U.S. Dairy Industry wants to estimate the mean yearly milk consumption. A sample of 25 people reveals the mean yearly consumption to be 82 gallons with a standard deviation of 24 gallons. Assume that the population distribution is normal. (Use Distribution Table.) a-1. What is the value of the population mean? 82 24 Unknown a-2. What is the best estimate of this value? Estimate population mean c. For a 90% confidence interval, what is the value...
T Distribution Table
The U.S. Dairy Industry wants to estimate the mean yearly milk consumption. A sample of 25 people reveals the mean yearly consumption to be 82 gallons with a standard deviation of 24 gallons. Assume that the population distribution is normal. (Use Distribution Table.) a-1. What is the value of the population mean? 82 24 Unknown a-2. What is the best estimate of this value? Estimate population mean c. For a 90% confidence interval, what is the value...
A random sample of 20 chocolate energy bars of a certain brand has, on average, 210...
 A random sample of 20 chocolate energy bars of a certain brand has, on average, 210 calories per bar, with a standard deviation of 15 calories. Construct a 99% confidence interval for the true mean calorie content of this brand of energy bar. Assume that the distribution of the calorie content is approximately normal. Click here to view page 1 of the standard normal distribution table. Click here to view page 2 of the standard normal distribution table. Click here...
(a) Is there a difference in the measurement of the muzzle velocity between device A and...
 (a) Is there a difference
in the measurement of the muzzle velocity between device A and
device B at the α = 0.01 level of significance? Note: A normal
probability plot and boxplot of the data indicate that the
differences are approximately normally distributed with no
outliers. Let di = Ai − Bi.
(i) Identify the null and alternative
hypotheses.
(ii) Determine the test statistic for
this hypothesis test (t0 = ?). Round to two
decimal places as needed.
(iii)...
(a) Is there a difference
in the measurement of the muzzle velocity between device A and
device B at the α = 0.01 level of significance? Note: A normal
probability plot and boxplot of the data indicate that the
differences are approximately normally distributed with no
outliers. Let di = Ai − Bi.
(i) Identify the null and alternative
hypotheses.
(ii) Determine the test statistic for
this hypothesis test (t0 = ?). Round to two
decimal places as needed.
(iii)...
t-distribution Table -Distribution Area in Right Tail 0.025 0.02 df 0.25 0.20 0.15 0.10 0.05 0.01...
 t-distribution Table -Distribution Area in Right Tail 0.025 0.02 df 0.25 0.20 0.15 0.10 0.05 0.01 0.005 0.0025 0.001 0.0005 3 6 1.000 1.3761.963 0.816 1.061 1.386 0.765 0.978 1.250 0.741 0.941 1.190 0.727 0.9201.156 0.718 0.906 1.134 0.7110.8961.119 0.706 0.889 1.108 0.703 0.883 1.100 0.700 0.879 1.093 0.697 0.876 1.088 0.695 0.873 1.083 0.694 0.870 1.079 0.692 0.868 1.076 0.691 0.866 1.074 0.690 0.865 1.071 0.689 0.863 1.069 0.688 0.862 1.067 0.688 0.861 1.066 3.078 1.886 1.638 1.533 1.476...
(a) Does the evidence suggest that community college transfer students take longer to attain a bachelor's...
 (a) Does the evidence suggest that community
college transfer students take longer to attain a bachelor's
degree? Use an α = 0.05 level of significance. Perform a hypothesis
test. Determine the null and alternative hypotheses.
(b) Determine the test statistic (t =
?) and the P-value (P = ?). Round to two decimal
places as needed.
(c) Construct a 90% confidence interval for
(μcommunity college − μno transfer) to
approximate the mean additional time it takes to complete a
bachelor's...
(a) Does the evidence suggest that community
college transfer students take longer to attain a bachelor's
degree? Use an α = 0.05 level of significance. Perform a hypothesis
test. Determine the null and alternative hypotheses.
(b) Determine the test statistic (t =
?) and the P-value (P = ?). Round to two decimal
places as needed.
(c) Construct a 90% confidence interval for
(μcommunity college − μno transfer) to
approximate the mean additional time it takes to complete a
bachelor's...
t-Distribution Area in Right Tail .
 t-Distribution Area in Right Tail
Degrees of Freedom 0.25 0.2
0.15 0.10 0.05
0.025 0.02 0.01
0.005 0.0025 0.001 0.0005
1 1.000 1.376 1.963
3.078 6.314 12.706
15.894 31.821 63.657
127.321 318.309 636.619
2 0.816 1.061 1.386
1.886 2.920 4.303
4.849 6.965 9.925
14.089 22.327 31.599
3 0.765 0.978 1.250
1.638 2.353 3.182
3.482 4.541 5.841
7.453 10.215 12.924
4 0.741 0.941 ...
t-Distribution Area in Right Tail
Degrees of Freedom 0.25 0.2
0.15 0.10 0.05
0.025 0.02 0.01
0.005 0.0025 0.001 0.0005
1 1.000 1.376 1.963
3.078 6.314 12.706
15.894 31.821 63.657
127.321 318.309 636.619
2 0.816 1.061 1.386
1.886 2.920 4.303
4.849 6.965 9.925
14.089 22.327 31.599
3 0.765 0.978 1.250
1.638 2.353 3.182
3.482 4.541 5.841
7.453 10.215 12.924
4 0.741 0.941 ...
 T Distribution Table
The U.S. Dairy Industry wants to estimate the mean yearly milk consumption. A sample of 25 people reveals the mean yearly consumption to be 82 gallons with a standard deviation of 24 gallons. Assume that the population distribution is normal. (Use Distribution Table.) a-1. What is the value of the population mean? 82 24 Unknown a-2. What is the best estimate of this value? Estimate population mean c. For a 90% confidence interval, what is the value...
T Distribution Table
The U.S. Dairy Industry wants to estimate the mean yearly milk consumption. A sample of 25 people reveals the mean yearly consumption to be 82 gallons with a standard deviation of 24 gallons. Assume that the population distribution is normal. (Use Distribution Table.) a-1. What is the value of the population mean? 82 24 Unknown a-2. What is the best estimate of this value? Estimate population mean c. For a 90% confidence interval, what is the value...
 A random sample of 20 chocolate energy bars of a certain brand has, on average, 210 calories per bar, with a standard deviation of 15 calories. Construct a 99% confidence interval for the true mean calorie content of this brand of energy bar. Assume that the distribution of the calorie content is approximately normal. Click here to view page 1 of the standard normal distribution table. Click here to view page 2 of the standard normal distribution table. Click here...
 (a) Is there a difference
in the measurement of the muzzle velocity between device A and
device B at the α = 0.01 level of significance? Note: A normal
probability plot and boxplot of the data indicate that the
differences are approximately normally distributed with no
outliers. Let di = Ai − Bi.
(i) Identify the null and alternative
hypotheses.
(ii) Determine the test statistic for
this hypothesis test (t0 = ?). Round to two
decimal places as needed.
(iii)...
(a) Is there a difference
in the measurement of the muzzle velocity between device A and
device B at the α = 0.01 level of significance? Note: A normal
probability plot and boxplot of the data indicate that the
differences are approximately normally distributed with no
outliers. Let di = Ai − Bi.
(i) Identify the null and alternative
hypotheses.
(ii) Determine the test statistic for
this hypothesis test (t0 = ?). Round to two
decimal places as needed.
(iii)...
 t-distribution Table -Distribution Area in Right Tail 0.025 0.02 df 0.25 0.20 0.15 0.10 0.05 0.01 0.005 0.0025 0.001 0.0005 3 6 1.000 1.3761.963 0.816 1.061 1.386 0.765 0.978 1.250 0.741 0.941 1.190 0.727 0.9201.156 0.718 0.906 1.134 0.7110.8961.119 0.706 0.889 1.108 0.703 0.883 1.100 0.700 0.879 1.093 0.697 0.876 1.088 0.695 0.873 1.083 0.694 0.870 1.079 0.692 0.868 1.076 0.691 0.866 1.074 0.690 0.865 1.071 0.689 0.863 1.069 0.688 0.862 1.067 0.688 0.861 1.066 3.078 1.886 1.638 1.533 1.476...
 (a) Does the evidence suggest that community
college transfer students take longer to attain a bachelor's
degree? Use an α = 0.05 level of significance. Perform a hypothesis
test. Determine the null and alternative hypotheses.
(b) Determine the test statistic (t =
?) and the P-value (P = ?). Round to two decimal
places as needed.
(c) Construct a 90% confidence interval for
(μcommunity college − μno transfer) to
approximate the mean additional time it takes to complete a
bachelor's...
(a) Does the evidence suggest that community
college transfer students take longer to attain a bachelor's
degree? Use an α = 0.05 level of significance. Perform a hypothesis
test. Determine the null and alternative hypotheses.
(b) Determine the test statistic (t =
?) and the P-value (P = ?). Round to two decimal
places as needed.
(c) Construct a 90% confidence interval for
(μcommunity college − μno transfer) to
approximate the mean additional time it takes to complete a
bachelor's...
 t-Distribution Area in Right Tail
Degrees of Freedom 0.25 0.2
0.15 0.10 0.05
0.025 0.02 0.01
0.005 0.0025 0.001 0.0005
1 1.000 1.376 1.963
3.078 6.314 12.706
15.894 31.821 63.657
127.321 318.309 636.619
2 0.816 1.061 1.386
1.886 2.920 4.303
4.849 6.965 9.925
14.089 22.327 31.599
3 0.765 0.978 1.250
1.638 2.353 3.182
3.482 4.541 5.841
7.453 10.215 12.924
4 0.741 0.941 ...
t-Distribution Area in Right Tail
Degrees of Freedom 0.25 0.2
0.15 0.10 0.05
0.025 0.02 0.01
0.005 0.0025 0.001 0.0005
1 1.000 1.376 1.963
3.078 6.314 12.706
15.894 31.821 63.657
127.321 318.309 636.619
2 0.816 1.061 1.386
1.886 2.920 4.303
4.849 6.965 9.925
14.089 22.327 31.599
3 0.765 0.978 1.250
1.638 2.353 3.182
3.482 4.541 5.841
7.453 10.215 12.924
4 0.741 0.941 ...
Most questions answered within 3 hours.
-
Where is the error in this code sequence?
String s1 = "Hello";
String s2 = "ello";...
asked 10 months ago -
Financial data for Joel de Paris, Inc., for last year
follow:
Joel de Paris, Inc.
Balance...
asked 10 months ago -
Consider this reaction:
Al2(SO4)3 (aq)+ BaCl3
(aq) Al2Cl6 (aq)- +
3BaSO4(s) . What is the...
asked 10 months ago -
Suppose that Savneet is considering increasing her
recent random sample from 20 car rentals to 40...
asked 10 months ago -
Trucks arrive at an unloading terminal at an average rate of 120
per hour.
Trucks arrive...
asked 10 months ago -
Why are methanol and ethanol completely soluble in water while
octanol is not very little soluble....
asked 10 months ago -
A facilities manager at a university reads in a research report
that the mean amount of...
asked 10 months ago -
When the CuSO4 is rehydrated by adding water to the anhydrous
compound, is this an endothermic...
asked 10 months ago -
A ray of sunlight is passing from diamond into crown glass; the
angle of incidence is...
asked 10 months ago -
A block of mass 0.249 kg is placed on top of a light, vertical
spring of...
asked 10 months ago -
how do the kidneys compensate in the presences of acidosis
a) trigger hyperventilate
b) reserve acid...
asked 10 months ago -
Question 501 pts
The rental rate of capital to the firm increases. Which of the
following...
asked 10 months ago