x y 1 5.92 2 9.44 3 11.36 4 14.08 5 17 6 15.92 7 17.74...
|
||||||||||||||||||||||||||||||||
based on the data shown, calculate the regression line (each value to two decimal places)
y= __________x + _______
Homework Answers
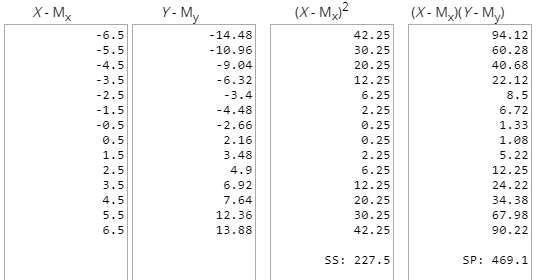
Sum of X = 105
Sum of Y = 285.6
Mean X = 7.5
Mean Y = 20.4
Sum of squares (SSX) = 227.5
Sum of products (SP) = 469.1
Regression Equation = ŷ = bX + a
b = SP/SSX = 469.1/227.5 =
2.06
a = MY - bMX = 20.4 -
(2.06*7.5) = 4.94
ŷ = 2.06X + 4.94
Consider the data: X- 1 Y- 6 3 14 5 7 2 20 9 11 10...
 Consider the data: X- 1 Y- 6 3 14 5 7 2 20 9 11 10 18 13 15 26 22 (a) Calculate the correlation between X and Y. 0.7399 (b) What percent of the variation in Y can be attributed to X? (Round to a whole percent) 55 % (c) Obtain the equation of the regression line for these data y = X +
The following sample observations were randomly selected: 1 2 3 4 5 X: 17 4 2...
The following sample observations were randomly selected: 1 2 3 4 5 X: 17 4 2 7 6 Y: 13 25 6 15 15 a. Determine the regression equation. (Negative answer should be indicated by a minus sign. Do not round intermediate calculations. Round the final answers to 4 decimal places.) b = a = Y' = + X b. Determine the value of Y' when X is 13. (Do not round intermediate calculations. Round the final...
2. Use least-squares regression to fit a straight line to r 6 7 11 15 17 21 23 29 29 37 39 29 21 ...
 2. Use least-squares regression to fit a straight line to r 6 7 11 15 17 21 23 29 29 37 39 29 21 29 14 21 157 13 03 Plot the data and the regression line using Matlab (submit plot). If someone made an additional measurement of 10. y 10, would you suspect, based on a visual assessment and the standard error, that the measurement was valid or faulty? Explain.
2. Use least-squares regression to fit a straight line...
2. Use least-squares regression to fit a straight line to r 6 7 11 15 17 21 23 29 29 37 39 29 21 29 14 21 157 13 03 Plot the data and the regression line using Matlab (submit plot). If someone made an additional measurement of 10. y 10, would you suspect, based on a visual assessment and the standard error, that the measurement was valid or faulty? Explain.
2. Use least-squares regression to fit a straight line...
x y 5 6 6 9 7 11 8 13 9 14 10 15 11 15...
x y 5 6 6 9 7 11 8 13 9 14 10 15 11 15 12 13 a) Generate a model for y as a function of x b) Is this model useful? Justify your conclusion based on i) R2 adjusted, ii) Hypothesis test for model coefficient, iii) overall model adequacy test and iv) regression assumptions c) If needed, modify model as appropriate and generate the new model. *Complete all parts of the problem please, be as detailed with...
Sample No. 1 2 3 4 5 6 No. Defectives 7 5 20 10 12 7...
 Sample No. 1 2 3 4 5 6 No. Defectives 7 5 20 10 12 7 13 10 5 12 Sample No. 11 12 13 14 15 16 17 18 19 20 No. Defectives 6 6 15 4 12 7 12 3 19 16 Sample No. 21 22 23 24 25 26 27 28 29 30 No. Defectives 17 13 5 7 14 9 13 6 13 3 7 8 9 10 a) Establish 3a upper and lower controllimits. UCL...
Year 1. 2 3 4 5 Returns X Y 12 % 25 % 28 34 9...
 Year 1. 2 3 4 5 Returns X Y 12 % 25 % 28 34 9 13 - 7 - 27 10 14 Using the returns shown above, calculate the arithmetic average returns, the variances, and the standard deviations for X and Y. (Do not round intermediate calculations. Enter your average return and standard deviation as a percent rounded to 2 decimal places, e.g., 32.16, and round the variance to 5 decimal places, e.g., .16161.) % % Average return Variance...
Based on the data shown below, calculate the correlation coefficient (to three decimal places) x y...
Based on the data shown below, calculate the correlation coefficient (to three decimal places) x y 5 13.95 6 15.44 7 17.93 8 17.12 9 16.91 10 18.7 11 20.09 12 18.68 13 21.27 14 20.26 15 21.35 16 20.74 17 23.23 18 23.62 19 20.71
educ wage 17 8.19 12 18.42 12 23.38 12 10.24 12 20.47 12 12.90 12 31.03...
 educ
wage
17
8.19
12
18.42
12
23.38
12
10.24
12
20.47
12
12.90
12
31.03
17
14.33
14
12.28
10
17.77
16
15.56
12
13.31
16
15.76
11
9.62
12
14.08
13
17.93
11
29.68
12
24.24
11
17.07
16
33.74
14
36.85
12
18.42
16
10.85
18
28.37
9
8.72
13
8.27
12
16.83
14
24.07
12
11.59
The data set wages educ (click the link to open the Excel file) contains data from a survey on hourly...
educ
wage
17
8.19
12
18.42
12
23.38
12
10.24
12
20.47
12
12.90
12
31.03
17
14.33
14
12.28
10
17.77
16
15.56
12
13.31
16
15.76
11
9.62
12
14.08
13
17.93
11
29.68
12
24.24
11
17.07
16
33.74
14
36.85
12
18.42
16
10.85
18
28.37
9
8.72
13
8.27
12
16.83
14
24.07
12
11.59
The data set wages educ (click the link to open the Excel file) contains data from a survey on hourly...
Given are five observations for two variables, x and y. xi 1 2 3 4 5...
Given are five observations for two variables, x and y. xi 1 2 3 4 5 yi 3 7 8 11 14 Which of the following scatter diagrams accurately represents the data? 1. 2. 3. SelectScatter diagram #1Scatter diagram #2Scatter diagram #3Item 1 What does the scatter diagram indicate about the relationship between the two variables? SelectThere appears to be a linear relationship between x and yThere appears to be a nonlinear relationship between x and yItem 2 Try to...
Based on the data shown below, calculate the regression line (each value to two decimal places)...
 Based on the data shown below, calculate the regression line (each value to two decimal places) x y 4 12.16 5 16.75 6 19.04 7 18.43 8 | 22.32 9 23.51 10 24.9 11 | 29.79 12 33.28 1334.67 14 33.76 15 38.65 16 39.54 17 41.63
 Consider the data: X- 1 Y- 6 3 14 5 7 2 20 9 11 10 18 13 15 26 22 (a) Calculate the correlation between X and Y. 0.7399 (b) What percent of the variation in Y can be attributed to X? (Round to a whole percent) 55 % (c) Obtain the equation of the regression line for these data y = X +
 2. Use least-squares regression to fit a straight line to r 6 7 11 15 17 21 23 29 29 37 39 29 21 29 14 21 157 13 03 Plot the data and the regression line using Matlab (submit plot). If someone made an additional measurement of 10. y 10, would you suspect, based on a visual assessment and the standard error, that the measurement was valid or faulty? Explain.
2. Use least-squares regression to fit a straight line...
2. Use least-squares regression to fit a straight line to r 6 7 11 15 17 21 23 29 29 37 39 29 21 29 14 21 157 13 03 Plot the data and the regression line using Matlab (submit plot). If someone made an additional measurement of 10. y 10, would you suspect, based on a visual assessment and the standard error, that the measurement was valid or faulty? Explain.
2. Use least-squares regression to fit a straight line...
 Sample No. 1 2 3 4 5 6 No. Defectives 7 5 20 10 12 7 13 10 5 12 Sample No. 11 12 13 14 15 16 17 18 19 20 No. Defectives 6 6 15 4 12 7 12 3 19 16 Sample No. 21 22 23 24 25 26 27 28 29 30 No. Defectives 17 13 5 7 14 9 13 6 13 3 7 8 9 10 a) Establish 3a upper and lower controllimits. UCL...
 Year 1. 2 3 4 5 Returns X Y 12 % 25 % 28 34 9 13 - 7 - 27 10 14 Using the returns shown above, calculate the arithmetic average returns, the variances, and the standard deviations for X and Y. (Do not round intermediate calculations. Enter your average return and standard deviation as a percent rounded to 2 decimal places, e.g., 32.16, and round the variance to 5 decimal places, e.g., .16161.) % % Average return Variance...
 educ
wage
17
8.19
12
18.42
12
23.38
12
10.24
12
20.47
12
12.90
12
31.03
17
14.33
14
12.28
10
17.77
16
15.56
12
13.31
16
15.76
11
9.62
12
14.08
13
17.93
11
29.68
12
24.24
11
17.07
16
33.74
14
36.85
12
18.42
16
10.85
18
28.37
9
8.72
13
8.27
12
16.83
14
24.07
12
11.59
The data set wages educ (click the link to open the Excel file) contains data from a survey on hourly...
educ
wage
17
8.19
12
18.42
12
23.38
12
10.24
12
20.47
12
12.90
12
31.03
17
14.33
14
12.28
10
17.77
16
15.56
12
13.31
16
15.76
11
9.62
12
14.08
13
17.93
11
29.68
12
24.24
11
17.07
16
33.74
14
36.85
12
18.42
16
10.85
18
28.37
9
8.72
13
8.27
12
16.83
14
24.07
12
11.59
The data set wages educ (click the link to open the Excel file) contains data from a survey on hourly...
 Based on the data shown below, calculate the regression line (each value to two decimal places) x y 4 12.16 5 16.75 6 19.04 7 18.43 8 | 22.32 9 23.51 10 24.9 11 | 29.79 12 33.28 1334.67 14 33.76 15 38.65 16 39.54 17 41.63
Most questions answered within 3 hours.
-
Where is the error in this code sequence?
String s1 = "Hello";
String s2 = "ello";...
asked 11 months ago -
Financial data for Joel de Paris, Inc., for last year
follow:
Joel de Paris, Inc.
Balance...
asked 11 months ago -
Consider this reaction:
Al2(SO4)3 (aq)+ BaCl3
(aq) Al2Cl6 (aq)- +
3BaSO4(s) . What is the...
asked 11 months ago -
Suppose that Savneet is considering increasing her
recent random sample from 20 car rentals to 40...
asked 11 months ago -
Trucks arrive at an unloading terminal at an average rate of 120
per hour.
Trucks arrive...
asked 11 months ago -
Why are methanol and ethanol completely soluble in water while
octanol is not very little soluble....
asked 11 months ago -
A facilities manager at a university reads in a research report
that the mean amount of...
asked 11 months ago -
When the CuSO4 is rehydrated by adding water to the anhydrous
compound, is this an endothermic...
asked 11 months ago -
A ray of sunlight is passing from diamond into crown glass; the
angle of incidence is...
asked 11 months ago -
A block of mass 0.249 kg is placed on top of a light, vertical
spring of...
asked 11 months ago -
how do the kidneys compensate in the presences of acidosis
a) trigger hyperventilate
b) reserve acid...
asked 11 months ago -
Question 501 pts
The rental rate of capital to the firm increases. Which of the
following...
asked 11 months ago