A school principal was interested in whether students in the chess club scored above or below...
-
A school principal was interested in whether students in the chess club scored above or below the mean grade point average (GPA) at her school. She calculated the average GPA at the school to be 2.55 with σ = .5 and noted that the distribution was approximately normal. She then calculated the average GPA for 15 students in the chess club. Their mean GPA was 2.76. Did this group represent a population different from students in general at this school? (Use the .05 significance level.)
a) Use the four steps of hypothesis testing b) Illustrate the distributions involved
c) Calculate the 95% confidence interval {*even if ns (non-significant result)}
Homework Answers
Given : Sample size=n=15
Sample mean=
Population standard deviation=
Population mean=
Significance level=
a) Hypothesis :  Vs
Vs 
The test statistic is ,

Critical value : 
Rejection Region :

Decision : Here , 
Therefore , fail to reject the Ho
Conclusion : Hence , there is not sufficient evidence to conclude that the students in the chess club scored above or below the mean grade point average (GPA) at her school.
(b) Here , population standard deviation  is known
Therefore , use the normal distribution
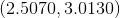
(c) The 95% confidence interval is ,


Add Answer to:
A school principal was interested in whether students in the
chess club scored above or below...
1. A university researcher is interested in whether efforts to recruit more top high school students...
1. A university researcher is interested in whether efforts to recruit more top high school students have been successful. To test this, she randomly selects 50 freshmen from the university and records their high school GPA. The mean is 2.75 with a standard deviation of 0.50. The researcher also knows that the mean high school GPA of all freshmen enrolled at the university five years ago was 3.00 with a standard deviation of 0.66. The researcher wants to know if...
A principal claims the students in his school have above-average test scores for a particular standardized...
A principal claims the students in his school have above-average test scores for a particular standardized test. A sample of 50 students from his school were found to have an average test score of 77.2. The population mean for test scores for this particular test is 75, with a standard deviation of 9 (so we can assume that the population test score is normally distributed). Set up a hypothesis test to determine whether this principal’s claim is correct (use alpha...
We are interested in examining the IQ scores of college students versus the average population IQ....
We are interested in examining the IQ scores of college students versus the average population IQ. We take a sample of 25 college students and have them take the WAIS. Our sample of college students had an average WAIS of 110, and the known population mean for the WAIS is 100 with σ= 15. a. What type of statistical test should we conduct (z score, one sample t test, independent measures t test, repeated measures t test)? How do you...
A cognitive psychologist is interested in whether increasing reading speed improves comprehension. He has students complete...
 A cognitive psychologist is interested in whether increasing reading speed improves comprehension. He has students complete a reading comprehension task before and after a six-week speed reading course. In the beginning of the study, a randomly selected group of B1 students scored an average of 102 points on the reading comprehension task. Since the sample size is larger than 30, the cognitive psychologist can assume that the sampling distribution of M_D is normal. He plans to use a repeated-measures t-test....
Researchers were interested whether students self-identifying as conservative or liberal at a local community college differed...
Researchers were interested whether students self-identifying as conservative or liberal at a local community college differed on Grade Point Average (GPA). The sample data were entered into a statistical software program, and the output for the F test is shown below. To compare the two means, would it be appropriate to use a t test that assumes equal variances? F-Test Two-Sample for Variances Conservative Liberal Mean 3.156 3.182 Variance 0.26 0.24 Observations 45 113 df 44 112 F 1.0827 P(F<=f)...
1.You are interested in estimating the effects of owning a tablet (such as an iPad) on...
1.You are interested in estimating the effects of owning a tablet (such as an iPad) on the grades of high school students (the idea is that owning a tablet might help students take notes and study more effectively). You have data on tablet ownership and GPA for a sample of 1000 students. You wish to estimate this model: GPA=B0+B1tablet+u where GPA is the student's grade point average measured on a scale of 0-4, and tablet is a dummy variable that...
For a certain law school, the entering students have an average LSAT score of about 700...
For a certain law school, the entering students have an average LSAT score of about 700 with a standard deviation of about 40. The smoothed density histogram of the LSAT scores appears to follow a normal distribution. Sketch a smoothed density histogram (a bell-shaped curve) of the distributions for the LSAT scores. (For this problem, draw this on your own paper. You will not need to submit this graph.) Because this distribution is approximately normal, the mean is equal to...
PSY 3200 Unit 84 AS: Hypothesls Testing for Distribution of Means In this assignment studlents will...
 PSY 3200 Unit 84 AS: Hypothesls Testing for Distribution of Means In this assignment studlents will demonstrate thelr understanding of the distribution of means doing all steps of hypothesls testing. For eadh probiem students will write out all steps of hypothesis testing indluding populations, hypotheses, outoff scores, and all relevant calculations. Assignments will be typed and uploaded in a word document to blackboard 1. A nationwide survey in 1995 revealed that U.S grade-school children spend an average of u R4hars...
in comparing the engagement levels of first-year statistics students. In a previous nation-wide study, engagement levels...
in comparing the engagement levels of first-year statistics students. In a previous nation-wide study, engagement levels were found to be normally distributed, with µ=60.00, σ=10.00. The lecturer collects a convenience sample of 50 first-year students and finds that her students have a mean engagement level equal to 75.54. What statistical procedure should be used, to test whether there is a significant mean difference in engagement levels between the lecturer’s first year students and the population average? a. One sample Z-test....
ministrators at Ventura College are interested whether the average height of all students at v inches...
 ministrators at Ventura College are interested whether the average height of all students at v inches (5'6"). They use the survey data from Professor Friedman's classes. For this exercise, 18 students in Professor Friedman's classes are a good representation for height of all stu se the computer summary output below where the units are inches for the mean and a0.10 level that the mean height of Ventura College students is above 66 inches (5'6"). entura College is above ume that...
 A cognitive psychologist is interested in whether increasing reading speed improves comprehension. He has students complete a reading comprehension task before and after a six-week speed reading course. In the beginning of the study, a randomly selected group of B1 students scored an average of 102 points on the reading comprehension task. Since the sample size is larger than 30, the cognitive psychologist can assume that the sampling distribution of M_D is normal. He plans to use a repeated-measures t-test....
 PSY 3200 Unit 84 AS: Hypothesls Testing for Distribution of Means In this assignment studlents will demonstrate thelr understanding of the distribution of means doing all steps of hypothesls testing. For eadh probiem students will write out all steps of hypothesis testing indluding populations, hypotheses, outoff scores, and all relevant calculations. Assignments will be typed and uploaded in a word document to blackboard 1. A nationwide survey in 1995 revealed that U.S grade-school children spend an average of u R4hars...
 ministrators at Ventura College are interested whether the average height of all students at v inches (5'6"). They use the survey data from Professor Friedman's classes. For this exercise, 18 students in Professor Friedman's classes are a good representation for height of all stu se the computer summary output below where the units are inches for the mean and a0.10 level that the mean height of Ventura College students is above 66 inches (5'6"). entura College is above ume that...
Most questions answered within 3 hours.
-
Where is the error in this code sequence?
String s1 = "Hello";
String s2 = "ello";...
asked 10 months ago -
Financial data for Joel de Paris, Inc., for last year
follow:
Joel de Paris, Inc.
Balance...
asked 10 months ago -
Consider this reaction:
Al2(SO4)3 (aq)+ BaCl3
(aq) Al2Cl6 (aq)- +
3BaSO4(s) . What is the...
asked 10 months ago -
Suppose that Savneet is considering increasing her
recent random sample from 20 car rentals to 40...
asked 10 months ago -
Trucks arrive at an unloading terminal at an average rate of 120
per hour.
Trucks arrive...
asked 10 months ago -
Why are methanol and ethanol completely soluble in water while
octanol is not very little soluble....
asked 10 months ago -
A facilities manager at a university reads in a research report
that the mean amount of...
asked 10 months ago -
When the CuSO4 is rehydrated by adding water to the anhydrous
compound, is this an endothermic...
asked 10 months ago -
A ray of sunlight is passing from diamond into crown glass; the
angle of incidence is...
asked 10 months ago -
A block of mass 0.249 kg is placed on top of a light, vertical
spring of...
asked 10 months ago -
how do the kidneys compensate in the presences of acidosis
a) trigger hyperventilate
b) reserve acid...
asked 10 months ago -
Question 501 pts
The rental rate of capital to the firm increases. Which of the
following...
asked 10 months ago