Construct the confidence interval for the population variance for the given values. Round your answers to...
Construct the confidence interval for the population variance for the given values. Round your answers to one decimal place.
n=14, s2=13.1, and c=0.8
Homework Answers
We have given here,
Sample variance =13.1
Sample size =14
Degree of freedom =n-1= 13
Level of significance given =1-0.80=0.2
Chi square critical value for lower tail=7.042
Chi square critical value for upper tail=19.812
We can use here confidence interval formula for population
variance

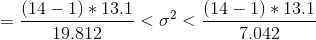
=(8.6,24.2)
Lower confidence limit for population variance=8.6
Upper confidence limit for population variance =24.2
Add Answer to:
Construct the
confidence interval for the population variance for the given
values. Round your answers to...
Construct the confidence interval for the population variance for the given values. Round your answers to...
Construct the confidence interval for the population variance for the given values. Round your answers to one decimal place. n=25, s2=38.3, and c=0.95
Construct the confidence interval for the population variance for the given values. Round your answers to...
Construct the confidence interval for the population variance for the given values. Round your answers to one decimal place. n=13 , s2=9.8, and c=0.98
Construct the confidence interval for the population variance for the given values. Round your answers to...
Construct the confidence interval for the population variance for the given values. Round your answers to one decimal place. n=27, s^2 =10.5 and c=0.9
Construct the confidence interval for the population standard deviation for the given values. Round your answers...
Construct the confidence interval for the population standard deviation for the given values. Round your answers to one decimal place. n=23, s=9.9, and c=0.95 Could someone help teach me the formula to solve this in Excel! Thanks so much!
Determine the critical values for the confidence interval for the population variance from the given values....
Determine the critical values for the confidence interval for the population variance from the given values. Round your answers to three decimal places. n=11 and α=0.1.
Determine the critical values for the confidence interval for the population variance from the given values....
Determine the critical values for the confidence interval for the population variance from the given values. Round your answers to three decimal places. n=18 and α=0.05.
Determine the critical values for the confidence interval for the population variance from the given values....
Determine the critical values for the confidence interval for the population variance from the given values. Round your answers to three decimal places. n = 13 and α = 0.05 Answer: blank and blank
Find the critical values x?and XR for the given confidence level c and sample size n....
 Find the critical values x?and XR for the given confidence level c and sample size n. C=0.8, n=30 xL= (Round to three decimal places as needed.) Find the critical values x and x for the given confidence level c and sample size n. c=0.9, n=21 x?L= (Round to three decimal places as needed.) Use technology to construct the confidence intervals for the population variance o2 and the population standard deviation o. Assume the sample is taken from a normally distributed...
Find a 90% confidence interval for a population mean μ for these values. (Round your answers...
Find a 90% confidence interval for a population mean μ for these values. (Round your answers to three decimal places.) (a) n = 105, x = 0.81, s2 = 0.089 (b) n = 90, x = 21.3, s2 = 3.53 (c) Interpret the intervals found in part (a) and part (b): A. There is a 10% chance that an individual sample proportion will fall within the interval. B. In repeated sampling, 90% of all intervals constructed in this manner will...
Construct the indicated confidence interval for the population mean μ using the t distribution. Assume the...
 Construct the indicated confidence interval for the population mean μ using the t distribution. Assume the population is normally distributed c:0.98, x=13.1, s:0 82, n; 13 Round to one decimal place as needed)
 Find the critical values x?and XR for the given confidence level c and sample size n. C=0.8, n=30 xL= (Round to three decimal places as needed.) Find the critical values x and x for the given confidence level c and sample size n. c=0.9, n=21 x?L= (Round to three decimal places as needed.) Use technology to construct the confidence intervals for the population variance o2 and the population standard deviation o. Assume the sample is taken from a normally distributed...
 Construct the indicated confidence interval for the population mean μ using the t distribution. Assume the population is normally distributed c:0.98, x=13.1, s:0 82, n; 13 Round to one decimal place as needed)
Most questions answered within 3 hours.
-
Where is the error in this code sequence?
String s1 = "Hello";
String s2 = "ello";...
asked 11 months ago -
Financial data for Joel de Paris, Inc., for last year
follow:
Joel de Paris, Inc.
Balance...
asked 11 months ago -
Consider this reaction:
Al2(SO4)3 (aq)+ BaCl3
(aq) Al2Cl6 (aq)- +
3BaSO4(s) . What is the...
asked 11 months ago -
Suppose that Savneet is considering increasing her
recent random sample from 20 car rentals to 40...
asked 11 months ago -
Trucks arrive at an unloading terminal at an average rate of 120
per hour.
Trucks arrive...
asked 11 months ago -
Why are methanol and ethanol completely soluble in water while
octanol is not very little soluble....
asked 11 months ago -
A facilities manager at a university reads in a research report
that the mean amount of...
asked 11 months ago -
When the CuSO4 is rehydrated by adding water to the anhydrous
compound, is this an endothermic...
asked 11 months ago -
A ray of sunlight is passing from diamond into crown glass; the
angle of incidence is...
asked 11 months ago -
A block of mass 0.249 kg is placed on top of a light, vertical
spring of...
asked 11 months ago -
how do the kidneys compensate in the presences of acidosis
a) trigger hyperventilate
b) reserve acid...
asked 11 months ago -
Question 501 pts
The rental rate of capital to the firm increases. Which of the
following...
asked 11 months ago