taste Acetic H2S Lactic 12.3 4.543 3.135 0.86 20.9 5.159 5.043 1.53 39 5.366 5.438 1.57...
| taste | Acetic | H2S | Lactic | |
| 12.3 | 4.543 | 3.135 | 0.86 | |
| 20.9 | 5.159 | 5.043 | 1.53 | |
| 39 | 5.366 | 5.438 | 1.57 | |
| 47.9 | 5.759 | 7.496 | 1.81 | |
| 5.6 | 4.663 | 3.807 | 0.99 | |
| 25.9 | 5.697 | 7.601 | 1.09 | |
| 37.3 | 5.892 | 8.726 | 1.29 | |
| 21.9 | 6.078 | 7.966 | 1.78 | |
| 18.1 | 4.898 | 3.85 | 1.29 | |
| 21 | 5.242 | 4.174 | 1.58 | |
| 34.9 | 5.74 | 6.142 | 1.68 | |
| 57.2 | 6.446 | 7.908 | 1.9 | |
| 0.7 | 4.477 | 2.996 | 1.06 | |
| 25.9 | 5.236 | 4.942 | 1.3 | |
| 54.9 | 6.151 | 6.752 | 1.52 | |
| 40.9 | 6.365 | 9.588 | 1.74 | |
| 15.9 | 4.787 | 3.912 | 1.16 | |
| 6.4 | 5.412 | 4.7 | 1.49 | |
| 18 | 5.247 | 6.174 | 1.63 | |
| 38.9 | 5.438 | 9.064 | 1.99 | |
| 14 | 4.564 | 4.949 | 1.15 | |
| 15.2 | 5.298 | 5.22 | 1.33 | |
| 32 | 5.455 | 9.242 | 1.44 | |
| 56.7 | 5.855 | 10.199 | 2.01 | |
| 16.8 | 5.366 | 3.664 | 1.31 | |
| 11.6 | 6.043 | 3.219 | 1.46 | |
| 26.5 | 6.458 | 6.962 | 1.72 | |
| 0.7 | 5.328 | 3.912 | 1.25 | |
| 13.4 | 5.802 | 6.685 | 1.08 | |
| 5.5 | 6.176 | 4.787 | 1.25 |
Estimate the equation of the regression line predicting taste score based on all three predictor variables in a single equation.
What taste score would you predict for a cheese whose hydrogen sulfide measurement was 5.0, whose acetic acid measurement was 6.1, and whose lactic acid measurement was 0.90?
What proportion of the variability in taste can be explained by the model using all three predictor variables?
Homework Answers
The regression model that we want to estimate is

where  is the
intercept,
is the
intercept,  are the slope coefficients and
  is a random error
In Excel, setup the regression using data--->data analysis-->regression
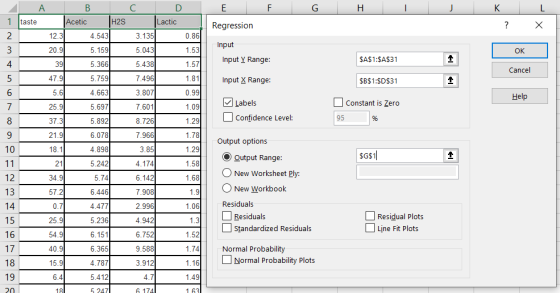
get this
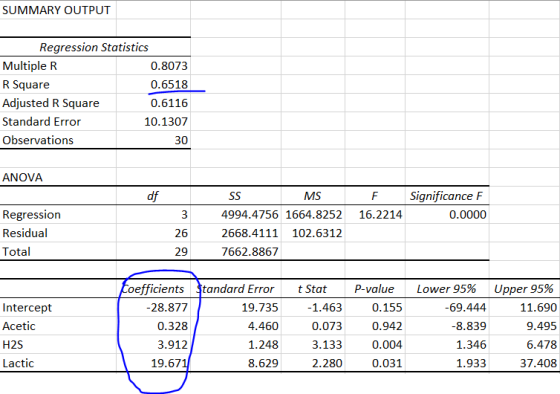
ans: the equation of the regression line predicting taste score based on all three predictor variables in a single equation is

Substituting H2S=5, Acetic=6.1 and Lactic=0.90 in the above equation we get

ans: the predicted taste score would be 10.39
The value of R-square from the output is 
This indicates that
ans: 65.18% of the variability in taste can be explained by the model using all three predictor variables.
Add Answer to:
taste
Acetic
H2S
Lactic
12.3
4.543
3.135
0.86
20.9
5.159
5.043
1.53
39
5.366
5.438
1.57...
Most questions answered within 3 hours.
-
Where is the error in this code sequence?
String s1 = "Hello";
String s2 = "ello";...
asked 11 months ago -
Financial data for Joel de Paris, Inc., for last year
follow:
Joel de Paris, Inc.
Balance...
asked 11 months ago -
Consider this reaction:
Al2(SO4)3 (aq)+ BaCl3
(aq) Al2Cl6 (aq)- +
3BaSO4(s) . What is the...
asked 11 months ago -
Suppose that Savneet is considering increasing her
recent random sample from 20 car rentals to 40...
asked 11 months ago -
Trucks arrive at an unloading terminal at an average rate of 120
per hour.
Trucks arrive...
asked 11 months ago -
Why are methanol and ethanol completely soluble in water while
octanol is not very little soluble....
asked 11 months ago -
A facilities manager at a university reads in a research report
that the mean amount of...
asked 11 months ago -
When the CuSO4 is rehydrated by adding water to the anhydrous
compound, is this an endothermic...
asked 11 months ago -
A ray of sunlight is passing from diamond into crown glass; the
angle of incidence is...
asked 11 months ago -
A block of mass 0.249 kg is placed on top of a light, vertical
spring of...
asked 11 months ago -
how do the kidneys compensate in the presences of acidosis
a) trigger hyperventilate
b) reserve acid...
asked 11 months ago -
Question 501 pts
The rental rate of capital to the firm increases. Which of the
following...
asked 11 months ago