If a traffic stream on a rural highway displays an average headway of 3.2 seconds and...
If a traffic stream on a rural highway displays an average headway of 3.2 seconds and an average spacing of 185ft, what would be the:
1) Average annual daily traffic if directional distribution (D) is equally split
Homework Answers


Add Answer to:
If a traffic stream on a rural highway displays an average
headway of 3.2 seconds and...
The traffic on a two-way two-lane highway is assumed to follow Greenberg model. The average headway...
 The traffic on a two-way two-lane highway is assumed to follow Greenberg model. The average headway at Capacity is 1.9 seconds while the average spacing at jam conditions is 9 meters. At 9:00 AM on a typical weekday, two platoons were travelling on the highway in the eastbound direction. The length of the first platoon is 3 km and the average vehicle speed in this platoon is 62 km/h. The second platoon is a long platoon that starts directly to...
If there are 50 vehicles on a 4000-ft highway lane and the average time headway between...
 If there are 50 vehicles on a 4000-ft highway lane and the average time headway between two adjacent vehicles is 2.2 seconds. 3. Calculate traffic density in vehicle/mile (vpm) and average space headway in feet/vehicle (fpv) (1pt) 1) 2) Calculate traffic volume in vehicle/hour (vph). (1pt) 3) Calculate space-mean speed of the traffic on that lane. (1 pt)
Transportation Engineering I. A highway transportation agency is conducting a traffic count on an existing highway...
 Transportation Engineering
I. A highway transportation agency is conducting a traffic count on an existing highway for the purpose of determine the directional design volume. An automatic traffic counter using a weigh-in-motion (WIM) equipment gave a total continuous one-year count of 4,372,096 axles. Manual classification studies at the count station indicated the following: Passenger cars = 3-axle trucks 4-axle trucks 5-axle trucks = 69% 21% 6% 4% (a) Calculate the existing average annual daily traffic (AADT) in vehicles per day....
Transportation Engineering
I. A highway transportation agency is conducting a traffic count on an existing highway for the purpose of determine the directional design volume. An automatic traffic counter using a weigh-in-motion (WIM) equipment gave a total continuous one-year count of 4,372,096 axles. Manual classification studies at the count station indicated the following: Passenger cars = 3-axle trucks 4-axle trucks 5-axle trucks = 69% 21% 6% 4% (a) Calculate the existing average annual daily traffic (AADT) in vehicles per day....
The avernge headway at alocation on a segment of sk Sree is 10 seconds. Obtain an...
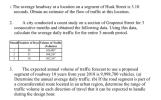 The avernge headway at alocation on a segment of sk Sree is 10 seconds. Obtain an estimate of the flow of traffic at this location. 2. A city conducted a count study on a section of Grapenut Street for 3 consecutive months and obtained the following data. Using this data, calculate the average daily traffic for the entire 3-month period. Month Number of Days Volume of Traffic 28 31 30 (Vehicles) 456,007 498,247 502,367 3. The expected annual volume of...
1. What is the flow rate if the average headway between 100 vehicles is 5 seconds?...
 1. What is the flow rate if the average headway between 100 vehicles is 5 seconds? 2. What is the difference between time-mean speed and space-mean speed? 3. How would you observe the speed, flow, and density of a roadway? Using Greenshields, what is the speed of traffic if the free flow speed is 70 miles per hour, the current density is 70 vehicles per mile, and the jam density is 70 vehicles per mile? 4. What is the speed...
"Time headway" in traffic flow is the elapsed time between the time that one car finishes...
 "Time headway" in traffic flow is the elapsed time between the time that one car finishes passing a fixed point and the instant that the next car begins to pass that point. Let X = the time headway for two randomly chosen consecutive cars on a freeway during a period of heavy flow (sec). Suppose that in a particular traffic environment, the distribution of time headway has the following form. k. X > 1 f(x) = 6 10 X51 (a)...
A West Coast Expressway segment is planned for a rural area with a desion 1. Average...
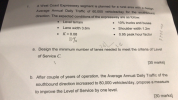 A West Coast Expressway segment is planned for a rural area with a desion 1. Average Annual Daily Traffic of 60,000 vehicles/day for the southbound direction. The expected conditions of the expressway are as follow Level terrain Lane width 3.6m K= 0.08 87% 10% trucks and buses Shoulder width 1.2m 0.95 peak hour factor Design the minimum number of lanes needed to meet the criteria of Level a. of Service C. [30 marks] b. After couple of years of operation,...
3. What are the two microscopic traffic stream parameters? 4. In speed-flow-density relationships, we use which...
 3. What are the two microscopic traffic stream parameters? 4. In speed-flow-density relationships, we use which speed? (space mean speed)/ (time mean speed) 5. Time headway is the time difference between bumpers/rear bumpers 6. The speed limit on a highway is set based on 85a percentile speed. True /False 7. You should be able to identify the following basic q-u-k relationships (shape), what's on x and what's on y, and salient points on the curves. of two successive vehicles. Front...
2. A class 1, 30mile long rural two-lane highway segment is in rolling terrain. Peak demand...
 2. A class 1, 30mile long rural two-lane highway segment is in rolling terrain. Peak demand is 900 vph (total for both directions), with a 70:30 directional split, and consists of 20% trucks (no rv's or busses). The PHF is 0.80. There are 80% no passing zones, and the base free-flow speed is 55 mi/h. Lane and shoulder widths width are 11 and 2 ft, respectively. There are 6 access points per mile. a) Estimate the average travel speed in...
According to the National Highway Traffic Safety Administration, the average age of a driver involved in...
According to the National Highway Traffic Safety Administration, the average age of a driver involved in a fatal crash is 39.4 years, with a standard deviation of 17.4 years. Suppose a random sample of 50 drivers involved in a fatal crash is selected. [Source: https://crashstats.nhtsa.dot.gov/Api/Public/ViewPublication/810853] What is the probability that the average age of drivers involved in fatal crash in the sample exceeds 41? Question 24 options: A) 0.5359 B) 0.4641 C) 0.7422 D) 0.2578 E) 0.6502
 The traffic on a two-way two-lane highway is assumed to follow Greenberg model. The average headway at Capacity is 1.9 seconds while the average spacing at jam conditions is 9 meters. At 9:00 AM on a typical weekday, two platoons were travelling on the highway in the eastbound direction. The length of the first platoon is 3 km and the average vehicle speed in this platoon is 62 km/h. The second platoon is a long platoon that starts directly to...
 If there are 50 vehicles on a 4000-ft highway lane and the average time headway between two adjacent vehicles is 2.2 seconds. 3. Calculate traffic density in vehicle/mile (vpm) and average space headway in feet/vehicle (fpv) (1pt) 1) 2) Calculate traffic volume in vehicle/hour (vph). (1pt) 3) Calculate space-mean speed of the traffic on that lane. (1 pt)
 Transportation Engineering
I. A highway transportation agency is conducting a traffic count on an existing highway for the purpose of determine the directional design volume. An automatic traffic counter using a weigh-in-motion (WIM) equipment gave a total continuous one-year count of 4,372,096 axles. Manual classification studies at the count station indicated the following: Passenger cars = 3-axle trucks 4-axle trucks 5-axle trucks = 69% 21% 6% 4% (a) Calculate the existing average annual daily traffic (AADT) in vehicles per day....
Transportation Engineering
I. A highway transportation agency is conducting a traffic count on an existing highway for the purpose of determine the directional design volume. An automatic traffic counter using a weigh-in-motion (WIM) equipment gave a total continuous one-year count of 4,372,096 axles. Manual classification studies at the count station indicated the following: Passenger cars = 3-axle trucks 4-axle trucks 5-axle trucks = 69% 21% 6% 4% (a) Calculate the existing average annual daily traffic (AADT) in vehicles per day....
 The avernge headway at alocation on a segment of sk Sree is 10 seconds. Obtain an estimate of the flow of traffic at this location. 2. A city conducted a count study on a section of Grapenut Street for 3 consecutive months and obtained the following data. Using this data, calculate the average daily traffic for the entire 3-month period. Month Number of Days Volume of Traffic 28 31 30 (Vehicles) 456,007 498,247 502,367 3. The expected annual volume of...
 1. What is the flow rate if the average headway between 100 vehicles is 5 seconds? 2. What is the difference between time-mean speed and space-mean speed? 3. How would you observe the speed, flow, and density of a roadway? Using Greenshields, what is the speed of traffic if the free flow speed is 70 miles per hour, the current density is 70 vehicles per mile, and the jam density is 70 vehicles per mile? 4. What is the speed...
 "Time headway" in traffic flow is the elapsed time between the time that one car finishes passing a fixed point and the instant that the next car begins to pass that point. Let X = the time headway for two randomly chosen consecutive cars on a freeway during a period of heavy flow (sec). Suppose that in a particular traffic environment, the distribution of time headway has the following form. k. X > 1 f(x) = 6 10 X51 (a)...
 A West Coast Expressway segment is planned for a rural area with a desion 1. Average Annual Daily Traffic of 60,000 vehicles/day for the southbound direction. The expected conditions of the expressway are as follow Level terrain Lane width 3.6m K= 0.08 87% 10% trucks and buses Shoulder width 1.2m 0.95 peak hour factor Design the minimum number of lanes needed to meet the criteria of Level a. of Service C. [30 marks] b. After couple of years of operation,...
 3. What are the two microscopic traffic stream parameters? 4. In speed-flow-density relationships, we use which speed? (space mean speed)/ (time mean speed) 5. Time headway is the time difference between bumpers/rear bumpers 6. The speed limit on a highway is set based on 85a percentile speed. True /False 7. You should be able to identify the following basic q-u-k relationships (shape), what's on x and what's on y, and salient points on the curves. of two successive vehicles. Front...
 2. A class 1, 30mile long rural two-lane highway segment is in rolling terrain. Peak demand is 900 vph (total for both directions), with a 70:30 directional split, and consists of 20% trucks (no rv's or busses). The PHF is 0.80. There are 80% no passing zones, and the base free-flow speed is 55 mi/h. Lane and shoulder widths width are 11 and 2 ft, respectively. There are 6 access points per mile. a) Estimate the average travel speed in...
Most questions answered within 3 hours.
-
Where is the error in this code sequence?
String s1 = "Hello";
String s2 = "ello";...
asked 11 months ago -
Financial data for Joel de Paris, Inc., for last year
follow:
Joel de Paris, Inc.
Balance...
asked 11 months ago -
Consider this reaction:
Al2(SO4)3 (aq)+ BaCl3
(aq) Al2Cl6 (aq)- +
3BaSO4(s) . What is the...
asked 11 months ago -
Suppose that Savneet is considering increasing her
recent random sample from 20 car rentals to 40...
asked 11 months ago -
Trucks arrive at an unloading terminal at an average rate of 120
per hour.
Trucks arrive...
asked 11 months ago -
Why are methanol and ethanol completely soluble in water while
octanol is not very little soluble....
asked 11 months ago -
A facilities manager at a university reads in a research report
that the mean amount of...
asked 11 months ago -
When the CuSO4 is rehydrated by adding water to the anhydrous
compound, is this an endothermic...
asked 11 months ago -
A ray of sunlight is passing from diamond into crown glass; the
angle of incidence is...
asked 11 months ago -
A block of mass 0.249 kg is placed on top of a light, vertical
spring of...
asked 11 months ago -
how do the kidneys compensate in the presences of acidosis
a) trigger hyperventilate
b) reserve acid...
asked 11 months ago -
Question 501 pts
The rental rate of capital to the firm increases. Which of the
following...
asked 11 months ago