Please use this description to calculate the values requested below (correct to 3 decimal places)... The...
Please use this description to calculate the values requested below (correct to 3 decimal places)...
The athletic departments at 10 randomly selected U.S. universities were asked by the Equal Employment Opportunity Commission to state what percentage of their nursing scholarships were presently held by women. The responses were 5, 4, 2, 1, 1, 2, 10, 2, 3, 5.
Geometric mean
Midhinge Trimmed mean (hint: use Minitab)
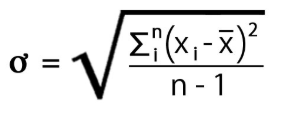
Standard deviation
IQR
Variance
MAD
CV (hint: write this as a percentage without the % symbol, not a proportion)
Skewness
Kurtosis
p-value for the Anderson-Darling normality test
Upper outer fence of the boxplot
Which distribution is least likely to be skewed to the right by high values?
Homework Answers
Mean (X bar) = Sum of Values /n
and
Hence, from the given data,
Mean = 3.5
Std Dev (s) = 2.718
Variance = s2 = 7.389
Median = 2.5
Quartile 1 (Q1) = 2
Quartile 3 (Q3) = 4.75
Midhinge Trimmed mean = (Q3+Q1)/2 = 3.375
IQR = Q3 – Q1 = 2
Skewness = 1.660
Kurtosis = 3.211
Add Answer to:
Please use this
description to calculate the values requested below (correct to 3
decimal places)...
The...
Please use this description to calculate the values requested below .. The athletic departments at 10...
Please use this description to calculate the values requested below .. The athletic departments at 10 randomly selected U.S. universities were asked by the Equal Employment Opportunity Commission to state what percentage of their nursing scholarships were presently held by women. The responses were 5, 4, 2, 1, 1, 2, 10, 2, 3, 5. to find the Geometric mean,Arithmetic mean, Median,Mode,Midhinge,Trimmed mean ,Standard deviation,IQR,Variance,Range,MAD,CV ,Skewness,Kurtosis,p-value for the Anderson-Darling normality test,Upper outer fence of the boxplot.
What does the five number tell us about the time spent on email (Hint, interpret the...
 What does the five number tell us about the time spent on email
(Hint, interpret the five number summary in plain English) and what
does the Boxplot and the normality test show? Explain.
Use the 1.5xIQR rule to identify possible outliers. List the
cutoff points for outliers, Show your workings. Explain what you
found out. (Hint: Are there any excessive time spent on email for
Male(1) or Female(2) or both).
GET DATA /TYPE-XLS /FILE='C: \Users\rmanda 1 \ Desktop\homework! . xls'...
What does the five number tell us about the time spent on email
(Hint, interpret the five number summary in plain English) and what
does the Boxplot and the normality test show? Explain.
Use the 1.5xIQR rule to identify possible outliers. List the
cutoff points for outliers, Show your workings. Explain what you
found out. (Hint: Are there any excessive time spent on email for
Male(1) or Female(2) or both).
GET DATA /TYPE-XLS /FILE='C: \Users\rmanda 1 \ Desktop\homework! . xls'...
Most questions answered within 3 hours.
-
Where is the error in this code sequence?
String s1 = "Hello";
String s2 = "ello";...
asked 10 months ago -
Financial data for Joel de Paris, Inc., for last year
follow:
Joel de Paris, Inc.
Balance...
asked 10 months ago -
Consider this reaction:
Al2(SO4)3 (aq)+ BaCl3
(aq) Al2Cl6 (aq)- +
3BaSO4(s) . What is the...
asked 10 months ago -
Suppose that Savneet is considering increasing her
recent random sample from 20 car rentals to 40...
asked 10 months ago -
Trucks arrive at an unloading terminal at an average rate of 120
per hour.
Trucks arrive...
asked 10 months ago -
Why are methanol and ethanol completely soluble in water while
octanol is not very little soluble....
asked 10 months ago -
A facilities manager at a university reads in a research report
that the mean amount of...
asked 10 months ago -
When the CuSO4 is rehydrated by adding water to the anhydrous
compound, is this an endothermic...
asked 10 months ago -
A ray of sunlight is passing from diamond into crown glass; the
angle of incidence is...
asked 10 months ago -
A block of mass 0.249 kg is placed on top of a light, vertical
spring of...
asked 10 months ago -
how do the kidneys compensate in the presences of acidosis
a) trigger hyperventilate
b) reserve acid...
asked 10 months ago -
Question 501 pts
The rental rate of capital to the firm increases. Which of the
following...
asked 10 months ago