FlorU football programs are printed 1 week prior to each home game. Attendance averages 90,000 screaming...
FlorU football programs are printed 1 week prior to each home game. Attendance averages 90,000 screaming and loyal Tators fans, of whom two-thirds usually buy the program, following a normal distribution with standard deviation of 5000 programs. A program sells for $4 each. Unsold programs are sent to a recycling center that pays 10 cents per program. The cost to print each program is $1.
- How many programs should be ordered per game to maximize expected profit?
- What is the stockout risk for this order size?
- How sensitive is the order quantity in (a) to the following
estimates?
- The standard deviation of demand
- The selling price of a program
- The cost of recycling an unsold program
Answer by considering at least 4 values of each quantity and calculating the corresponding order quantity. Draw a graph showing the effect of the above variables with order quantity on the Y axis. Comment briefly (1-2 lines) on each graph.
Homework Answers
The inventory management model to be used here is Single-Period Model.
Mean,  = (2/3) x 90,000 = 60,000 programs.
Standard deviation,  = 5,000 programs.
Cost per unit = $ 1.
Revenue per unit = $ 4.
Salvage value per unit = $ 0.10
Excess cost, Ce = Cost per unit – Salvage value per unit = 1 – 0.10 = $ 0.9
Shortage cost, Cs = Revenue per unit - Cost per unit = 4 – 1 = $ 3.
a.
Service Level, SL = Cs / (Cs + Ce) = 3 / (3+ 0.9) = 3 / 3.9 = 0.7692
Corresponding z value from Standard Normal Distribution Table = 0.74
Optimal order quantity, SO =
+ z.
= 60,000 + (0.74 x 5,000) = 63,700 programs.
Number of programs to be ordered per game to maximize expected profit = 63,700.
b.
Stockout Risk for this order quantity = 1 – SL = 1 – 0.7692 = 0.2308 = 23.08%
c.
Sensitivity to Standard Deviation of Demand:
(i) s = 6,000 programs.
Optimal order quantity, SO =
+ z.
= 60,000 + (0.74 x 6,000) = 64,440 programs.
(ii) s = 7,000 programs.
Optimal order quantity, SO =
+ z.
= 60,000 + (0.74 x 7,000) = 65,180 programs.
(iii) s = 8,000 programs.
Optimal order quantity, SO =
+ z.
= 60,000 + (0.74 x 8,000) = 65,920 programs.
(iv) s = 9,000 programs.
Optimal order quantity, SO =
+ z.
= 60,000 + (0.74 x 9,000) = 66,660 programs.
Sensitivity to Selling Price of Program:
(i) Selling Price or Revenue per unit = $ 5.
Shortage cost, Cs = Revenue per unit - Cost per unit = 5 – 1 = $ 4.
Service Level, SL = Cs / (Cs + Ce) = 4 / (4 + 0.9) = 4 / 4.9 = 0.8163
Corresponding z value from Standard Normal Distribution Table = 0.9
Optimal order quantity, SO =
+ z.
= 60,000 + (0.9 x 5,000) = 64,500 programs.
(ii) Selling Price or Revenue per unit = $ 6.
Shortage cost, Cs = Revenue per unit - Cost per unit = 6 – 1 = $ 5.
Service Level, SL = Cs / (Cs + Ce) = 5 / (5 + 0.9) = 5 / 5.9 = 0.8475
Corresponding z value from Standard Normal Distribution Table = 1.03
Optimal order quantity, SO =
+ z.
= 60,000 + (1.03 x 5,000) = 65,150 programs.
(iii) Selling Price or Revenue per unit = $ 7.
Shortage cost, Cs = Revenue per unit - Cost per unit = 7 – 1 = $ 6.
Service Level, SL = Cs / (Cs + Ce) = 6 / (6 + 0.9) = 6 / 6.9 = 0.8696
Corresponding z value from Standard Normal Distribution Table = 1.12
Optimal order quantity, SO =
+ z.
= 60,000 + (1.12 x 5,000) = 65,600 programs.
(iv) Selling Price or Revenue per unit = $ 8.
Shortage cost, Cs = Revenue per unit - Cost per unit = 8 – 1 = $ 7.
Service Level, SL = Cs / (Cs + Ce) = 7 / (7 + 0.9) = 7 / 7.9 = 0.8861
Corresponding z value from Standard Normal Distribution Table = 1.21
Optimal order quantity, SO =
+ z.
= 60,000 + (1.21 x 5,000) = 66,050 programs.
Sensitivity to Cost of Recycling an Unsold Program:
(i) Salvage value per unit = $ 0.20
Excess cost, Ce = Cost per unit – Salvage value per unit = 1 – 0.20 = $ 0.8
Shortage cost, Cs = Revenue per unit - Cost per unit = 4 – 1 = $ 3.
Service Level, SL = Cs / (Cs + Ce) = 3 / (3 + 0.8) = 3 / 3.8 = 0.7895
Corresponding z value from Standard Normal Distribution Table = 0.8
Optimal order quantity, SO =
+ z.
= 60,000 + (0.8 x 5,000) = 64,000 programs.
(ii) Salvage value per unit = $ 0.30
Excess cost, Ce = Cost per unit – Salvage value per unit = 1 – 0.30 = $ 0.7
Shortage cost, Cs = Revenue per unit - Cost per unit = 4 – 1 = $ 3.
Service Level, SL = Cs / (Cs + Ce) = 3 / (3 + 0.7) = 3 / 3.7 = 0.8108
Corresponding z value from Standard Normal Distribution Table = 0.84
Optimal order quantity, SO =
+ z.
= 60,000 + (0.84 x 5,000) = 64,200 programs.
(iii) Salvage value per unit = $ 0.40
Excess cost, Ce = Cost per unit – Salvage value per unit = 1 – 0.40 = $ 0.6
Shortage cost, Cs = Revenue per unit - Cost per unit = 4 – 1 = $ 3.
Service Level, SL = Cs / (Cs + Ce) = 3 / (3+ 0.6) = 3 / 3.6 = 0.8333
Corresponding z value from Standard Normal Distribution Table = 0.97
Optimal order quantity, SO =
+ z.
= 60,000 + (0.97 x 5,000) = 64,850 programs.
(iv) Salvage value per unit = $ 0.50
Excess cost, Ce = Cost per unit – Salvage value per unit = 1 – 0.50 = $ 0.50
Shortage cost, Cs = Revenue per unit - Cost per unit = 4 – 1 = $ 3.
Service Level, SL = Cs / (Cs + Ce) = 3 / (3 + 0.5) = 3 / 3.5 = 0.8571
Corresponding z value from Standard Normal Distribution Table = 1.07
Optimal order quantity, SO =
+ z.
= 60,000 + (1.07 x 5,000) = 65,350 programs.
The graph of variation of Optimal Order Quantity with Standard Deviation of Demand is given below:
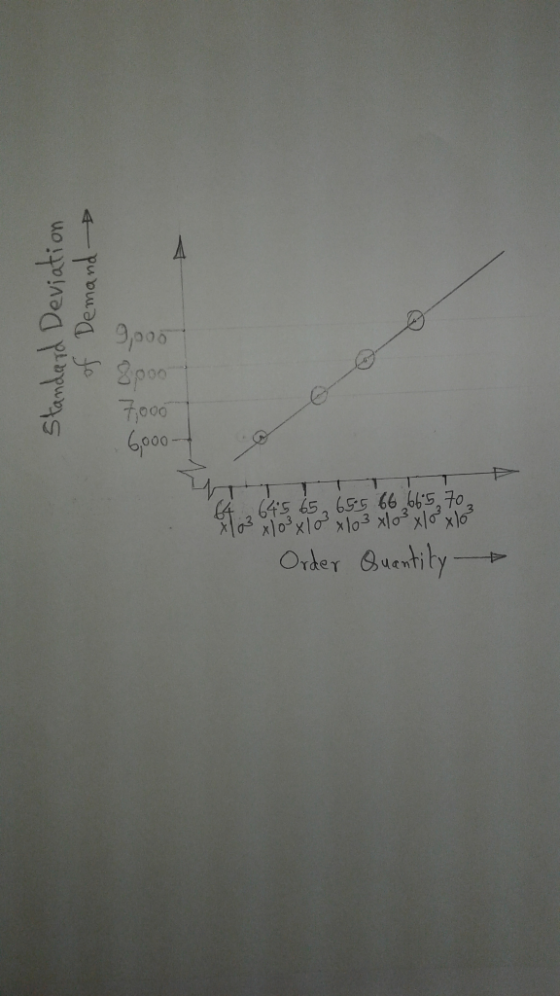
From the above graph, it can be seen that the variation of Optimal Order Quantity with Standard Deviation of Demand is exactly a straight line, since the Order Quantity changes by equal amount with change in Standard Deviation of Demand.
Add Answer to:
FlorU football programs are printed 1 week prior to each home
game. Attendance averages 90,000 screaming...
University of Florida football programs are printed 1 week prior to each home game. Attendance averages 90,000 screaming and loyal Gators fans, of whom two-thirds usually buy the program, following...
University of Florida football programs are printed 1 week prior to each home game. Attendance averages 90,000 screaming and loyal Gators fans, of whom two-thirds usually buy the program, following a normal distribution, for $55 each. Unsold programs are sent to a recycling center that pays only 10 cents per program. The standard deviation is 10,000 programs, and the cost to print each program is $11. Refer to the standard normal table LOADING... for z-values. a) What is the cost...
University of Florida football programs
University of Florida football programs are printed 1 week prior to each home game. Attendance averages 60,000 screaming and loyal Gatorsfans, of whom two-thirds usually buy the program, following a normal distribution, for $4 each. Unsold programs are sent to a recycling center that pays only 20 cents per program. The standard deviation is 10,000 programs, and the cost to print each program is $2. Refer to the standard normal table for z-values.a) What is the cost of underestimating demand...
Homework: Homework 4: Inventory Management Save Score: 0 of 1 pt 1 of 7 (2 complete)...
 Homework: Homework 4: Inventory Management Save Score: 0 of 1 pt 1 of 7 (2 complete) HW Score: 4.76%, 0.33 of 7 pts X Problem 12.53 Question Help 0 University of Florida football programs are printed 1 week prior to each home game. Attendance averages 90,000 screaming and loyal Gators fans, of whom two-thirds usually buy the program, following a normal distribution, for $4 Bach. Unsold programs are sent to a recycling center that pays only 20 cents per program....
please solve c HW Score: 63.08%, 41 of 65 pts Score: 0 of 8 pts 16...
 please solve c
HW Score: 63.08%, 41 of 65 pts Score: 0 of 8 pts 16 of 20 (12 complete) Question Help Problem 12.53 University of Florida football programs are printed 1 week prior to each home game. Attendance averages 75,000 screaming and loyal Gators fans, of whom two-thirds usually buy the program, following a normal distribution, for $4 each. Unsold programs are sent to a recycling center that pays only 20 cents per program. The standard deviation is 10,000...
please solve c
HW Score: 63.08%, 41 of 65 pts Score: 0 of 8 pts 16 of 20 (12 complete) Question Help Problem 12.53 University of Florida football programs are printed 1 week prior to each home game. Attendance averages 75,000 screaming and loyal Gators fans, of whom two-thirds usually buy the program, following a normal distribution, for $4 each. Unsold programs are sent to a recycling center that pays only 20 cents per program. The standard deviation is 10,000...
 Homework: Homework 4: Inventory Management Save Score: 0 of 1 pt 1 of 7 (2 complete) HW Score: 4.76%, 0.33 of 7 pts X Problem 12.53 Question Help 0 University of Florida football programs are printed 1 week prior to each home game. Attendance averages 90,000 screaming and loyal Gators fans, of whom two-thirds usually buy the program, following a normal distribution, for $4 Bach. Unsold programs are sent to a recycling center that pays only 20 cents per program....
 please solve c
HW Score: 63.08%, 41 of 65 pts Score: 0 of 8 pts 16 of 20 (12 complete) Question Help Problem 12.53 University of Florida football programs are printed 1 week prior to each home game. Attendance averages 75,000 screaming and loyal Gators fans, of whom two-thirds usually buy the program, following a normal distribution, for $4 each. Unsold programs are sent to a recycling center that pays only 20 cents per program. The standard deviation is 10,000...
please solve c
HW Score: 63.08%, 41 of 65 pts Score: 0 of 8 pts 16 of 20 (12 complete) Question Help Problem 12.53 University of Florida football programs are printed 1 week prior to each home game. Attendance averages 75,000 screaming and loyal Gators fans, of whom two-thirds usually buy the program, following a normal distribution, for $4 each. Unsold programs are sent to a recycling center that pays only 20 cents per program. The standard deviation is 10,000...
Most questions answered within 3 hours.
-
Where is the error in this code sequence?
String s1 = "Hello";
String s2 = "ello";...
asked 10 months ago -
Financial data for Joel de Paris, Inc., for last year
follow:
Joel de Paris, Inc.
Balance...
asked 10 months ago -
Consider this reaction:
Al2(SO4)3 (aq)+ BaCl3
(aq) Al2Cl6 (aq)- +
3BaSO4(s) . What is the...
asked 10 months ago -
Suppose that Savneet is considering increasing her
recent random sample from 20 car rentals to 40...
asked 10 months ago -
Trucks arrive at an unloading terminal at an average rate of 120
per hour.
Trucks arrive...
asked 10 months ago -
Why are methanol and ethanol completely soluble in water while
octanol is not very little soluble....
asked 10 months ago -
A facilities manager at a university reads in a research report
that the mean amount of...
asked 10 months ago -
When the CuSO4 is rehydrated by adding water to the anhydrous
compound, is this an endothermic...
asked 10 months ago -
A ray of sunlight is passing from diamond into crown glass; the
angle of incidence is...
asked 10 months ago -
A block of mass 0.249 kg is placed on top of a light, vertical
spring of...
asked 10 months ago -
how do the kidneys compensate in the presences of acidosis
a) trigger hyperventilate
b) reserve acid...
asked 10 months ago -
Question 501 pts
The rental rate of capital to the firm increases. Which of the
following...
asked 10 months ago