Country Suicides/ 100,000 Guatemala 2.5 United Arab Emirates 2.9 Venezuela, RB 3 Algeria 3.1 Lebanon 3.1...
| Country | Suicides/ 100,000 | |
| Guatemala | 2.5 | |
| United Arab Emirates | 2.9 | |
| Venezuela, RB | 3 | |
| Algeria | 3.1 | |
| Lebanon | 3.1 | |
| Myanmar | 4.3 | |
| Greece | 4.3 | |
| Mexico | 5 | |
| Israel | 5.5 | |
| Tunisia | 5.5 | |
| Peru | 5.8 | |
| Malta | 6 | |
| Colombia | 6.1 | |
| Brazil | 6.3 | |
| Kenya | 6.5 | |
| Ghana | 6.9 | |
| Ecuador | 7.5 | |
| Italy | 7.9 | |
| Ethiopia | 8.4 | |
| Spain | 8.5 | |
| United Kingdom | 8.5 | |
| Turkey | 8.7 | |
| Burkina Faso | 9.2 | |
| Nicaragua | 9.5 | |
| China | 10 | |
| Norway | 10.9 | |
| Luxembourg | 11.1 | |
| Ireland | 11.7 | |
| Australia | 11.8 | |
| New Zealand | 11.9 | |
| Denmark | 12.2 | |
| Canada | 12.3 | |
| Netherlands | 12.6 | |
| Iceland | 13.1 | |
| Germany | 13.4 | |
| Portugal | 13.6 | |
| Argentina | 14.2 | |
| United States | 14.3 | |
| Switzerland | 15.1 | |
| Sweden | 15.4 | |
| India | 15.7 | |
| Finland | 16.2 | |
| Austria | 16.4 | |
| France | 16.9 | |
| Japan | 19.6 | |
| Belgium | 20.5 | |
- Shape & Outliers. create a histogram and boxplot of the variable: suicide rates (per 100,000). Be sure to draw the boxplot horizontally and use fences to determine if the variable contains outliers. Describe the shape of the distribution.
The shape of this distribution is:
How many outliers does this distribution contain? < insert answer >
- Center & Spread. find the mean and standard deviation. Round your answers to the nearest thousandth.
Mean:
Standard Deviation:
- Is it Normal? In Statistics, it is reasonable to conclude that a variable follows a normal distribution if it’s shape is roughly symmetric (bell-shaped) with at most one outlier. Would it be reasonable to conclude that the suicide rates (per 100,000) for countries in the data table follow a normal distribution? Explain why or why not?
Homework Answers
Answer:
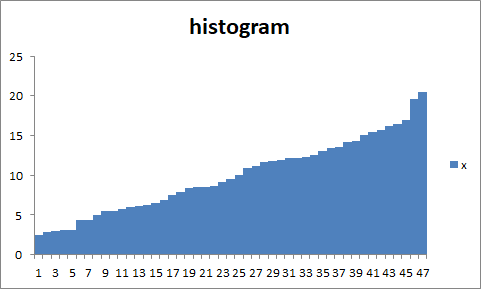
1) Histogram :
Using excel :
Path : Insert < charts < column
BOXPLOT:
Using MINITAB
Path : Graph< Boxplot

- From boxplot , outlier is not present in above data.
- From above histogram , the data are Left Skewed because most of values in data are clustered on the left side of the histogram. Data is increasing order.
2 ) From histogram we can say that , Shape of distribution does not contain outlier
3) Mean and Standard deviation
Using MInitab :
Path : stat < discriptive statistics
Mean = 9.917
standard deviation = 4.678
4) For Normal distribution histogram are symmetric . But here histogram is left skewed hence we conclude that the suicide rates (per 100,000) for countries in the data table not follow a normal distribution.
Add Answer to:
Country
Suicides/ 100,000
Guatemala
2.5
United Arab Emirates
2.9
Venezuela, RB
3
Algeria
3.1
Lebanon
3.1...
Most questions answered within 3 hours.
-
Where is the error in this code sequence?
String s1 = "Hello";
String s2 = "ello";...
asked 11 months ago -
Financial data for Joel de Paris, Inc., for last year
follow:
Joel de Paris, Inc.
Balance...
asked 11 months ago -
Consider this reaction:
Al2(SO4)3 (aq)+ BaCl3
(aq) Al2Cl6 (aq)- +
3BaSO4(s) . What is the...
asked 11 months ago -
Suppose that Savneet is considering increasing her
recent random sample from 20 car rentals to 40...
asked 11 months ago -
Trucks arrive at an unloading terminal at an average rate of 120
per hour.
Trucks arrive...
asked 11 months ago -
Why are methanol and ethanol completely soluble in water while
octanol is not very little soluble....
asked 11 months ago -
A facilities manager at a university reads in a research report
that the mean amount of...
asked 11 months ago -
When the CuSO4 is rehydrated by adding water to the anhydrous
compound, is this an endothermic...
asked 11 months ago -
A ray of sunlight is passing from diamond into crown glass; the
angle of incidence is...
asked 11 months ago -
A block of mass 0.249 kg is placed on top of a light, vertical
spring of...
asked 11 months ago -
how do the kidneys compensate in the presences of acidosis
a) trigger hyperventilate
b) reserve acid...
asked 11 months ago -
Question 501 pts
The rental rate of capital to the firm increases. Which of the
following...
asked 11 months ago