Achievement test scores of all high school seniors in a state have mean 60 and variance...
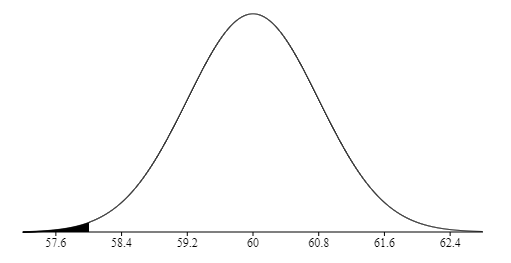
Achievement test scores of all high school seniors in a state have mean 60 and variance 64. A random sample of n = 100 students from one large high school had a mean score of 58. Is there evidence to suggest that this high school is inferior? (Calculate the probability that the sample mean is at most 58 when n = 100.) Show the appropriate graph of the sample mean.
Homework Answers
Here, μ = 60, σ = sqrt(64/100) = 0.8 and x = 58. We need to compute P(X <= 58). The corresponding z-value is calculated using Central Limit Theorem
z = (x - μ)/σ
z = (58 - 60)/0.8 = -2.5
Therefore,
P(X <= 58) = P(z <= (58 - 60)/0.8)
= P(z <= -2.5)
= 0.0062
Add Answer to:
Achievement test scores of all high school seniors in a state
have mean 60 and variance...
Show all work or show syntax for calculator! Please keep three decimal places for all problems...
 Show all work or show syntax for calculator!
Please keep three decimal places for all problems and provide SYNTAX if you do the problems by calculator 1. Achievement test scores of all high school seniors in a state have mean 60 and variance 64. A random sample of n= 100 students from one large high school had a mean score of 58. Is there evidence to suggest that this high school is inferior? (Calculate the probability that the sample mean...
Show all work or show syntax for calculator!
Please keep three decimal places for all problems and provide SYNTAX if you do the problems by calculator 1. Achievement test scores of all high school seniors in a state have mean 60 and variance 64. A random sample of n= 100 students from one large high school had a mean score of 58. Is there evidence to suggest that this high school is inferior? (Calculate the probability that the sample mean...
An achievement test given to high school seniors is used to predict college GPA. The following...
 An achievement test given to high school seniors is used to predict college GPA. The following relationship between the test scores and college GPA exists within the entire population of students: 1. Y 0.10+3.94 X+ E In the above, Y (response) is the college GPA of a given student, X is the student's score on the achievement test (predictor, scored as proportion correct, between 0 and 1), and e is random error, with E~N(0,.005), where the value.005 is the variance...
4. You want to estimate the mean SATM score for 250,000 high school seniors in California. Only a...
 4. You want to estimate the mean SATM score for 250,000 high school seniors in California. Only about 45% of California students take the SAT. These self-selected students are planning to attend college and are not representative of all California seniors A simple random sample (SRS) of 500 California high school seniors is tested. The mean score of the sample is Y 461. What could you say about the mean score, n-508 in the population of all 250,000 seniors? Assume...
1. Suppose the scores for high school seniors on the verbal portion of the SAT test...
1. Suppose the scores for high school seniors on the verbal portion of the SAT test have a population mean of 509 and a population standard deviation of 112. a. List the population and the variable. b. What do you know about the population distribution of SAT scores for high school seniors? (i.e. shape, center, spread) c. Suppose we randomly select 56 high school seniors from this population. What would you expect the shape, mean and standard deviation of the...
You want to estimate the mean SATM score for 250,000 high school seniors in California. Only abou...
 You want to estimate the mean SATM score for 250,000 high school seniors in California. Only about 45% of California students take the SAT. These self-selected students are planning to attend college and are not representative of all California seniors. A simple random sample (SRS) of 500 California high school seniors is tested. The mean score of the sample is Y = 461 What could you say about the mean score, η = 508 in the population of all 250,000...
High school seniors' SAT scores are normally distributed with μ = 1050 and σ = 100
2.) High school seniors' SAT scores are normally distributed with μ = 1050 and σ = 100. If a student is selected at random, find the probability that her SAT score is: a.) above 1200 b.) below 890 c.) between 1000 and 1100 d.) What SAT score separates the smartest 4% of students? e). If 18 seniors are selected, find the probability that their mean SAT score is above 1150 3.) A survey of 200 college students revealed that 160 of them eat dessert...
Scores of high school seniors taking the English Regents examination in New York State are normally...
Scores of high school seniors taking the English Regents examination in New York State are normally distributed with a mean of 70 and a standard deviation of 10. Find the probability that a randomly selected high school senior will have a score between 70 and 75?
IQ scores of college bound seniors in high school has the normal distribution with a mean...
IQ scores of college bound seniors in high school has the normal distribution with a mean 100 and standard deviation of 15. what is the IQ score at 2 standard deviation above the mean?
The National Assessment of Educational Progress (NAEP) includes a mathematics test for high school seniors. Scores...
The National Assessment of Educational Progress (NAEP) includes a mathematics test for high school seniors. Scores on the test range from 0 to 300. The NEAP test is given to a simple random sample of 900 12th graders from large population with μ=150 and σ=35. The sample mean, ??̅, will vary if you take repeated samples. Is the sample mean, ?̅, normally distributed? What is ??̅ and ??̅? What is the margin of error for a 95% Confidence interval? If...
The state test scores for 12randomly selected high school seniors are shown on the right. Assume...
The state test scores for 12randomly selected high school seniors are shown on the right. Assume the population is normally distributed. 1426 1227 984 695 723 830 730 744 544 624 1440 950 A-Find the sample mean B-Find sample standard deviation Round to one decimal place as needed.
 Show all work or show syntax for calculator!
Please keep three decimal places for all problems and provide SYNTAX if you do the problems by calculator 1. Achievement test scores of all high school seniors in a state have mean 60 and variance 64. A random sample of n= 100 students from one large high school had a mean score of 58. Is there evidence to suggest that this high school is inferior? (Calculate the probability that the sample mean...
Show all work or show syntax for calculator!
Please keep three decimal places for all problems and provide SYNTAX if you do the problems by calculator 1. Achievement test scores of all high school seniors in a state have mean 60 and variance 64. A random sample of n= 100 students from one large high school had a mean score of 58. Is there evidence to suggest that this high school is inferior? (Calculate the probability that the sample mean...
 An achievement test given to high school seniors is used to predict college GPA. The following relationship between the test scores and college GPA exists within the entire population of students: 1. Y 0.10+3.94 X+ E In the above, Y (response) is the college GPA of a given student, X is the student's score on the achievement test (predictor, scored as proportion correct, between 0 and 1), and e is random error, with E~N(0,.005), where the value.005 is the variance...
 4. You want to estimate the mean SATM score for 250,000 high school seniors in California. Only about 45% of California students take the SAT. These self-selected students are planning to attend college and are not representative of all California seniors A simple random sample (SRS) of 500 California high school seniors is tested. The mean score of the sample is Y 461. What could you say about the mean score, n-508 in the population of all 250,000 seniors? Assume...
 You want to estimate the mean SATM score for 250,000 high school seniors in California. Only about 45% of California students take the SAT. These self-selected students are planning to attend college and are not representative of all California seniors. A simple random sample (SRS) of 500 California high school seniors is tested. The mean score of the sample is Y = 461 What could you say about the mean score, η = 508 in the population of all 250,000...
Most questions answered within 3 hours.
-
Where is the error in this code sequence?
String s1 = "Hello";
String s2 = "ello";...
asked 11 months ago -
Financial data for Joel de Paris, Inc., for last year
follow:
Joel de Paris, Inc.
Balance...
asked 11 months ago -
Consider this reaction:
Al2(SO4)3 (aq)+ BaCl3
(aq) Al2Cl6 (aq)- +
3BaSO4(s) . What is the...
asked 11 months ago -
Suppose that Savneet is considering increasing her
recent random sample from 20 car rentals to 40...
asked 11 months ago -
Trucks arrive at an unloading terminal at an average rate of 120
per hour.
Trucks arrive...
asked 11 months ago -
Why are methanol and ethanol completely soluble in water while
octanol is not very little soluble....
asked 11 months ago -
A facilities manager at a university reads in a research report
that the mean amount of...
asked 11 months ago -
When the CuSO4 is rehydrated by adding water to the anhydrous
compound, is this an endothermic...
asked 11 months ago -
A ray of sunlight is passing from diamond into crown glass; the
angle of incidence is...
asked 11 months ago -
A block of mass 0.249 kg is placed on top of a light, vertical
spring of...
asked 11 months ago -
how do the kidneys compensate in the presences of acidosis
a) trigger hyperventilate
b) reserve acid...
asked 11 months ago -
Question 501 pts
The rental rate of capital to the firm increases. Which of the
following...
asked 11 months ago