Using python3, how do i convert a csv file to an xlsx file?
Homework Answers
CodeToCopy:
Note:
For installing pandas module, use this command in linux
$ sudo pip3 install pandas
csv_to_xlsx.py
# importing pandas module as pd
import pandas as pd
import sys
numArgs = len(sys.argv)
# checking number of command line arguments
# 1st argument -- input file path
# 2nd argument -- optional output file path; by default output file will be 'output.xlsx'
# 3rd argument -- delimiter between two fields; by defualt comma(,) will be a delimiter
if numArgs is 1 or numArgs > 4:
print("Usage: " + sys.argv[0] + " <input csv file> [output xlsx file path] [field_delimiter]")
exit(1)
# initializing variables with default variables
filepath_in = ""
filepath_out = "output.xlsx"
delimiter = ","
# taking input file path
if numArgs >= 2:
filepath_in = sys.argv[1]
# taking output file path
if numArgs >= 3:
filepath_out = sys.argv[2]
# taking field delimiter
if numArgs is 4:
delimiter = sys.argv[3]
try:
# converting csv file into xlsx file
pd.read_csv(filepath_in, delimiter).to_excel(filepath_out, index=False)
except Exception as e:
print("Error: " + str(e))
CodeIndentation:

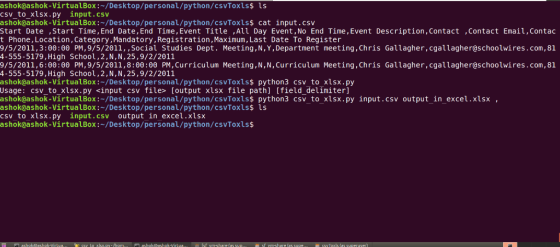
OutputScreenshot:
Hi I was wondering using C# how I would view a .CSV file, add a new...
Hi I was wondering using C# how I would view a .CSV file, add a new row then save the file?
When using the import wizard in MATLAB to import data fro, a .csv file the data...
When using the import wizard in MATLAB to import data fro, a .csv file the data appears in MATLAB in the following format "35:53.2" how do I convert this into more usable matlab values? I think that the duration function was used to generate the time format. I will leave feedback if you are able to provide a correct response. Thank you
How to make a table from a csv file without using prettytable or pandas. I have...
How to make a table from a csv file without using prettytable or pandas. I have to use format I'm trying to... I'm trying to get a column for "Type", "Total", and "Percent" from TipJoke.csv file. import csv with open('TipJoke.csv', newline='') as csv_file: filereader = csv.reader(csv_file, delimiter=' ') for row in filereader: print( '{:2} {:3} {:4}'.format('Type', 'Total', 'Percent')) print(', '.join(row))
How to make a table from a csv file without using prettytable and without pandas. I...
How to make a table from a csv file without using prettytable and without pandas. I have to use format I'm... I'm trying to get a column for "Type", "Total", and "Percent" from TipJoke.csv file. import csv with open('TipJoke.csv', newline='') as csv_file: filereader = csv.reader(csv_file, delimiter=' ') for row in filereader: print( '{:2} {:3} {:4}'.format('Type', 'Total', 'Percent')) print(', '.join(row))
Are you able to help me by explaining how to import data from a .csv file...
Are you able to help me by explaining how to import data from a .csv file into MATLAB using the import data wizard? I need to use the 'Generate Function' option in the import data wizard. How do I then call this data in MATLAB? Please help me Thank you
After Loading the .csv file into your R session (it could be any CSV file), and...
After Loading the .csv file into your R session (it could be any CSV file), and how can we do the following commands to find information (a)List column names of .csv file (b) change the name of the last two column respectively. Leave first column name as Year. (c)Confirm that column names have changed as expected. (d) Eliminate all rows with NA fields, if any. (e) Set "Year" as a factor. (f) Verify (e) has worked.
Java code to read from .csv file i currently have a .csv file that looks like...
Java code to read from .csv file i currently have a .csv file that looks like this: 39.743222, -105.006241, Hospital 39.743981, -105.020017, Home 39.739377, -104.984774, Firehouse 39.627779, -104.839291, McDonald's 39.731919, -104.961814, Chipotle I need to write code to extract the doubles from each line to use for my Linked List. this is what i have so far: Scanner in = new Scanner(new FileInputStream(DATA_FILE));
How do I perform a random draw from a fixed Bernoulli distribution using python3 for a...
How do I perform a random draw from a fixed Bernoulli distribution using python3 for a binary decision? From probability q, where its value ranges from 0 to 1 for a two-outcome case of either "no" or "yes", the closer it is to 1, the more likely the random draw will be "yes".
I have a BST database that i have to export to a .CSV file. i can...
I have a BST database that i have to export to a .CSV file. i can get it to export the first record. how can i get it to loop until the entire database is exported. void ActorBST::ExportToCSV(NodeActor *node) { string fileName; cout << "File Name(include .csv): "; cin >>fileName; ofstream myfile; myfile.open (fileName); myfile << "Year , Award, Winner, name, film"<< endl; myfile << node->year << "," << node->award << "," << node->winner << "," << node->name << ","...
--------__--------__Python--------__--------__ You will be reading in the data from the file SalesJan2009.csv. When you do, you...
--------__--------__Python--------__--------__ You will be reading in the data from the file SalesJan2009.csv. When you do, you need to save all the items from the PRICE field into a list called amtCollected. After you get them all in that list, you will need to create a variable called total that holds the sum of all the numbers in the list. Then create a variable called avg that holds the average of the numbers in the list. Now, print the following strings:...
Most questions answered within 3 hours.
-
Where is the error in this code sequence?
String s1 = "Hello";
String s2 = "ello";...
asked 10 months ago -
Financial data for Joel de Paris, Inc., for last year
follow:
Joel de Paris, Inc.
Balance...
asked 10 months ago -
Consider this reaction:
Al2(SO4)3 (aq)+ BaCl3
(aq) Al2Cl6 (aq)- +
3BaSO4(s) . What is the...
asked 10 months ago -
Suppose that Savneet is considering increasing her
recent random sample from 20 car rentals to 40...
asked 10 months ago -
Trucks arrive at an unloading terminal at an average rate of 120
per hour.
Trucks arrive...
asked 10 months ago -
Why are methanol and ethanol completely soluble in water while
octanol is not very little soluble....
asked 10 months ago -
A facilities manager at a university reads in a research report
that the mean amount of...
asked 10 months ago -
When the CuSO4 is rehydrated by adding water to the anhydrous
compound, is this an endothermic...
asked 10 months ago -
A ray of sunlight is passing from diamond into crown glass; the
angle of incidence is...
asked 10 months ago -
A block of mass 0.249 kg is placed on top of a light, vertical
spring of...
asked 10 months ago -
how do the kidneys compensate in the presences of acidosis
a) trigger hyperventilate
b) reserve acid...
asked 10 months ago -
Question 501 pts
The rental rate of capital to the firm increases. Which of the
following...
asked 10 months ago