Consider a situation where current output (real GDP) is currently below potential GDP. What type of...
Consider a situation where current output (real GDP) is currently below potential GDP. What type of fiscal policy will the government use to get to potential GDP? Draw an AD-AS diagram to illustrate this situation (including the initial situation)
Explain the figure in some detail. By this, we mean do not just explain the changes in the diagram, but also state what components of the AD and AS curves are changing (if any), and in which direction.
Homework Answers
When current GDP is below the level of potential GDP, then there is a recessionary gap in the economy. To help economy achieve the potential GDP level, the government will implement expansionary fiscal policy in the economy. As a part of it, government will increase spending and or decrease tax . It will cause aggregate demand and AD curve will shift to the right. It will make output to reach potential output level and price level also increases. It is shown by the following diagram.
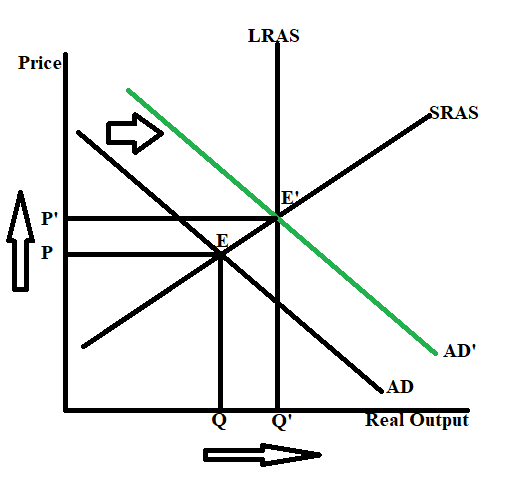
As per the above diagram the initial position is at equilibrium E with output to be Q and Price to be P. It is a real output to be less than the potential output level Q'. When government implements expansionary fiscal policy, then AD curve shifts to the right and reaches to the level of AD' curve. It makes economy to achieve equilibrium E' where the output is Q' and price level is P'. It is a long run equilibrium achieved.
Add Answer to:
Consider a situation where current output (real GDP) is
currently below potential GDP. What type of...
1. (a) Consider a situation where current output (real GDP) is currently above potential GDP. What...
1. (a) Consider a situation where current output (real GDP) is currently above potential GDP. What type of fiscal policy will the government use to get to potential GDP? Draw an AD-AS diagram to illustrate this situation (including the initial situation). Explain the figure in some detail. By this, we mean do not just explain the changes in the diagram, but also state what components of the AD and AS curves are changing (if any), and in which direction. (b)...
3. Consider an economy where current real GDP is equal to its potential level y'. (a)...
 3. Consider an economy where current real GDP is equal to its potential level y'. (a) Suppose that as a result of uncertainty over the future of trade relations between Canada and China, investment by firms in Canada falls. Use an AD-AS diagram to illustrate the effect of this drop in investment in the Canadian economy. (b) In response to negative economic conditions created in part (a), households decide to increase their savings because they fear they may soon lose...
L in in the following table shows what the situation will be in 2015 if the Price Level (CP) GDP ...
 l in in the following table shows what the situation will be in 2015 if the Price Level (CP) GDP Real GDP Price Level 2014 $1.55 trillion $1.55 trilion 2015 $1.61 trillion $1.55 trillion 124 Draw an aggregate demand and aggregate supply graph to illustrate the effects of Parliament's policy Assume that policy does not affect LRAS 1.) Use the line drawing tool to draw the LRAS curves for 2014 and 2015. Respectively label these curves LRAS2014 and 'LRAS2015 2.)...
answer only part c. so The hypothetical information in the following table shows what the situation...
 answer only part c.
so The hypothetical information in the following table shows what the situation will be in 2017 if Congress and the President do not use fiscal policy: Year 2016 2017 Potential GDP 17.8 trillion $18.2 trillion Price Level 113-7 115.9 Real GDP $17.8 trillion $17.8 trillion so a. If Congress and the president want to keep real GDP at its potential level in 2017, should they use an expansionary policy or a contractionary policy? In your so...
answer only part c.
so The hypothetical information in the following table shows what the situation will be in 2017 if Congress and the President do not use fiscal policy: Year 2016 2017 Potential GDP 17.8 trillion $18.2 trillion Price Level 113-7 115.9 Real GDP $17.8 trillion $17.8 trillion so a. If Congress and the president want to keep real GDP at its potential level in 2017, should they use an expansionary policy or a contractionary policy? In your so...
Price Level (CPI) The hypothetical information in the following table shows what the situation will be...
 Price Level (CPI) The hypothetical information in the following table shows what the situation will be in 2015 if the government does not use fiscal policy. 115 Potential Real Year GDP Real GDP Price Level 2014 2015 $1.52 trillion $1.57 trillion $1.52 trillion $1.52 trillion 106.0 108.3 a. If Parliament wants to keep real GDP at its potential level in 2015, it should use policy government purchases and/or The government should be taxes. 106 b. Parliament is successful in keeping...
Assume that the economy starts at potential output, and then there is a major decline in new home construction. a) Describe the short-run impact of this change on real GDP and the price level. Be spec...
Assume that the economy starts at potential output, and then there is a major decline in new home construction. a) Describe the short-run impact of this change on real GDP and the price level. Be specific about what component(s) of GDP change, and explain the economics behind the changes you describe. b) Assuming no further shocks/changes in policy, describe how the economy will transition from the short-run equilibrium in part a) to its long-run equilibrium. Be sure to explain the...
Suppose the economy starts out in a long-run equilibrium at potential GDP.. Draw the economy’s short-run...
Suppose the economy starts out in a long-run equilibrium at potential GDP.. Draw the economy’s short-run and long-run Phillips curves in one graph an AS/AD diagram with potential GDP shown in a second graph. Suppose a wave of business pessimism reduces aggregate demand. Show the effect of this shock on your diagrams from part a). Can the government return the economy to its original inflation rate and original unemployment rate using fiscal policy? Now start over with the economy back...
Consider an economy that begins with real GDP equal to potential GDP. There is then a...
Consider an economy that begins with real GDP equal to potential GDP. There is then a sudden increase in the prices of raw materials, which shifts the aggregate supply (AS)curve upward. a. Draw the initial long run equilibrium in an AD/AS diagram. b. Now show the immediate effect of the supply shock in your diagram. c. Suppose wages and prices in this economy adjust instantly to shocks. Explain what happens to unemployment in this economy. d. If wages and prices...
suppose the actual GDP is $15 trillion & the potential real GDP is $18 trillion. If the MPS is .03 What kind of GDP is this economy experiencing? what kind fiscal policy & monetary policy woul...
suppose the actual GDP is $15 trillion & the potential real GDP is $18 trillion. If the MPS is .03 What kind of GDP is this economy experiencing? what kind fiscal policy & monetary policy would u recommend to eliminate the gap (include a graph to illustrate the relationship) By how much the government should change taxes to eliminate the gap?
AS/AD: Assume the economy is currently at potential output. Then, a major increase in stock prices...
AS/AD: Assume the economy is currently at potential output. Then, a major increase in stock prices makes consumers feel wealthier, leading them to increase their consumption spending. a) What does it mean for the economy to be at “potential output”? What determines the potential output? b) Use the Aggregate Supply and Demand model to analyze the short-run impact that this new policy will have on real GDP and the price level. This is the “Shock.” c) Assuming no other changes...
 3. Consider an economy where current real GDP is equal to its potential level y'. (a) Suppose that as a result of uncertainty over the future of trade relations between Canada and China, investment by firms in Canada falls. Use an AD-AS diagram to illustrate the effect of this drop in investment in the Canadian economy. (b) In response to negative economic conditions created in part (a), households decide to increase their savings because they fear they may soon lose...
 l in in the following table shows what the situation will be in 2015 if the Price Level (CP) GDP Real GDP Price Level 2014 $1.55 trillion $1.55 trilion 2015 $1.61 trillion $1.55 trillion 124 Draw an aggregate demand and aggregate supply graph to illustrate the effects of Parliament's policy Assume that policy does not affect LRAS 1.) Use the line drawing tool to draw the LRAS curves for 2014 and 2015. Respectively label these curves LRAS2014 and 'LRAS2015 2.)...
 answer only part c.
so The hypothetical information in the following table shows what the situation will be in 2017 if Congress and the President do not use fiscal policy: Year 2016 2017 Potential GDP 17.8 trillion $18.2 trillion Price Level 113-7 115.9 Real GDP $17.8 trillion $17.8 trillion so a. If Congress and the president want to keep real GDP at its potential level in 2017, should they use an expansionary policy or a contractionary policy? In your so...
answer only part c.
so The hypothetical information in the following table shows what the situation will be in 2017 if Congress and the President do not use fiscal policy: Year 2016 2017 Potential GDP 17.8 trillion $18.2 trillion Price Level 113-7 115.9 Real GDP $17.8 trillion $17.8 trillion so a. If Congress and the president want to keep real GDP at its potential level in 2017, should they use an expansionary policy or a contractionary policy? In your so...
 Price Level (CPI) The hypothetical information in the following table shows what the situation will be in 2015 if the government does not use fiscal policy. 115 Potential Real Year GDP Real GDP Price Level 2014 2015 $1.52 trillion $1.57 trillion $1.52 trillion $1.52 trillion 106.0 108.3 a. If Parliament wants to keep real GDP at its potential level in 2015, it should use policy government purchases and/or The government should be taxes. 106 b. Parliament is successful in keeping...
Most questions answered within 3 hours.
-
Where is the error in this code sequence?
String s1 = "Hello";
String s2 = "ello";...
asked 10 months ago -
Financial data for Joel de Paris, Inc., for last year
follow:
Joel de Paris, Inc.
Balance...
asked 10 months ago -
Consider this reaction:
Al2(SO4)3 (aq)+ BaCl3
(aq) Al2Cl6 (aq)- +
3BaSO4(s) . What is the...
asked 10 months ago -
Suppose that Savneet is considering increasing her
recent random sample from 20 car rentals to 40...
asked 10 months ago -
Trucks arrive at an unloading terminal at an average rate of 120
per hour.
Trucks arrive...
asked 10 months ago -
Why are methanol and ethanol completely soluble in water while
octanol is not very little soluble....
asked 10 months ago -
A facilities manager at a university reads in a research report
that the mean amount of...
asked 10 months ago -
When the CuSO4 is rehydrated by adding water to the anhydrous
compound, is this an endothermic...
asked 10 months ago -
A ray of sunlight is passing from diamond into crown glass; the
angle of incidence is...
asked 10 months ago -
A block of mass 0.249 kg is placed on top of a light, vertical
spring of...
asked 10 months ago -
how do the kidneys compensate in the presences of acidosis
a) trigger hyperventilate
b) reserve acid...
asked 10 months ago -
Question 501 pts
The rental rate of capital to the firm increases. Which of the
following...
asked 10 months ago