Here are the results of a monthly index model of stock returns for FinCorp Stock: r(Fincorp)...
Here are the results of a monthly index model of stock returns for FinCorp Stock: r(Fincorp) = .001 + .8 r(S&P500) + e The standard deviation of the monthly return on the S&P 500 was .05. The standard deviation of the monthly value of the residual, e, was .03.
What was the variance of the return on FinCorp stock? Remember that e and the return on the S&P 500 are essentially uncorrelated. What was the standard deviation of the return on FinCorp stock?
Homework Answers
The results of the monthly index model here are expressed in the form below:

This form of the Capital Asset Pricing Model essentially differentiates between systematic and non systematic risk:
Systematic risk - indicated by the
segment  is also known as "undiversifiable" risk - meaning it is the risk
the investor is undertaking by putting money into that market and
is impossible to avoid
is also known as "undiversifiable" risk - meaning it is the risk
the investor is undertaking by putting money into that market and
is impossible to avoid
Unsystematic risk - indicated by the segment
 is known
as "diversifiable risk" is the risk taken on by investing in a
particular stock or company and can be removed by diversifying the
investment portfolio
is known
as "diversifiable risk" is the risk taken on by investing in a
particular stock or company and can be removed by diversifying the
investment portfolio
Now to solve the given question:
a) Since we are directly using the monthly returns of the
S&P Index, the market risk is essentially captured in that and
we do not need to worry about the risk free rate or  (by calculating
the standard deviation for the S&P index, we are already
accounting for all the risk, the investor is taking by investing in
this market)
(by calculating
the standard deviation for the S&P index, we are already
accounting for all the risk, the investor is taking by investing in
this market)
So, our formula now reduces to 
Now, we have already been told that return on S&P 500 and e
(or as per our
formula) are uncorrelated. This means that Covariance of  and = 0.
Therefore, taking the variance on both sides of the above formula, we get :

b) By the definition of Risk Free rate (), it is the return
that the investor shall definitely get in case money is invested in
a stock that gives such return. Which means that variance or
volatility in the return of the stock is 0
Therefore, our variance formula now reduces to:

c) The measure of variance is obtained simply by taking the square of the standard deviation of the variable. Hence, the above formula would become:

Where  refers to the
Standard deviation of the variable.
refers to the
Standard deviation of the variable.
Now, putting in the values:
 = 0.05,
 = 0.03 and
  = 0.8
= 0.8


So, the Variance of the Return on FinCorp Stock is 0.0025
Standard deviation is obtained by taking the square root of the Variance number, so in this case,
 or the Standard Deviation of the Fincorp Stock is 5%
Add Answer to:
Here are the results of a monthly index model of stock returns
for FinCorp Stock: r(Fincorp)...
Consider the two (excess return) index-model regression results for stocks A and B. The risk-free rate...
Consider the two (excess return) index-model regression results for stocks A and B. The risk-free rate over the period was 7%, and the market’s average return was 14%. Performance is measured using an index model regression on excess returns. Stock A Stock B Index model regression estimates 1% + 1.2(rM − rf) 2% + 0.8(rM − rf) R-square 0.635 0.466 Residual standard deviation, σ(e) 11.3% 20.1% Standard deviation of excess returns 22.6% 26.9% a. Calculate the following statistics for each...
Consider the two (excess return) index-model regression results for stocks A and B. The risk-free rate...
Consider the two (excess return) index-model regression results for stocks A and B. The risk-free rate over the period was 5%, and the market’s average return was 12%. Performance is measured using an index model regression on excess returns. Stock A Stock B Index model regression estimates 1% + 1.2(rM − rf) 2% + 0.8(rM − rf) R-square 0.599 0.448 Residual standard deviation, σ(e) 10.7% 19.5% Standard deviation of excess returns 22% 25.7% a. Calculate the following statistics for each...
Consider the two (excess return) index-model regression results for stocks A and B. The risk-free rate...
Consider the two (excess return) index-model regression results for stocks A and B. The risk-free rate over the period was 4%, and the market’s average return was 11%. Performance is measured using an index model regression on excess returns. Stock A Stock B Index model regression estimates 1% + 1.2(rM − rf) 2% + 0.8(rM − rf) R-square 0.683 0.49 Residual standard deviation, σ(e) 12.1% 20.9% Standard deviation of excess returns 23.4% 28.5% a. Calculate the following statistics for each...
The index model has been estimated from the excess returns for stock A with the following...
 The index model has been estimated from the excess returns for
stock A with the following results: RA = 12.00% + 1.20RM + eA σM =
24.00% σ(eA) = 15.00% What is the standard deviation of the return
for stock A?
The index model has been estimated from the excess returns for stock A with the following results: RA= 12.00% +1.20RM+ EA OM= 24.00% olea) = 15.00% What is the standard deviation of the return for stock A? (Round your...
The index model has been estimated from the excess returns for
stock A with the following results: RA = 12.00% + 1.20RM + eA σM =
24.00% σ(eA) = 15.00% What is the standard deviation of the return
for stock A?
The index model has been estimated from the excess returns for stock A with the following results: RA= 12.00% +1.20RM+ EA OM= 24.00% olea) = 15.00% What is the standard deviation of the return for stock A? (Round your...
Consider the two (excess return) index-model regression results for stocks A and B. The risk-free rate...
 Consider the two (excess return) index-model regression results for stocks A and B. The risk-free rate over the period was 8%, and the market's average return was 16%. Performance is measured using an index model regression on excess returns. Stock 18 + 1.2 (ry - rp) 0.677 Index model regression estimates R-square Residual standard deviation, (e) Standard deviation of excess returns Stock B 28 +0.8(IN - rf) 0.487 20.88 28.30 126 23.38 a. Calculate the following statistics for each stock:...
#05 A Saved Consider the two (excess return) index-model regression results for stocks A and B....
 #05 A Saved Consider the two (excess return) index-model regression results for stocks A and B. The risk-free rate over the period was 5%, a market's average return was 14%. Performance is measured using an index model regression on excess returns. Index model regression estimates R-square Residual standard deviation, ole) Standard deviation of excess returns Stock A 1% + 1.2 (rm -rf) 0.611 10.9% 22.2% Stock B 2% + 0.8(rm -rf) 0.454 19.7% 26.1% a. Calculate the following statistics for...
Problem 6 Part A.5 Consider the following regression output for the Single Index Model where excess returns on Microsof...
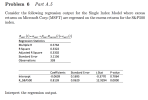 Problem 6 Part A.5 Consider the following regression output for the Single Index Model where excess returns on Microsoft Corp (MSFT) index regressed on the excess returns for the S&P500 are RMSFT ()aMFTPrsSPTRS&PS00 ()+eFT (t) S&P500 Regression Statistics Multiple R 0.5764 R Square 0.3322 Adjusted R Square 0.3302 Standard Error 3.1156 Observations 338 Coefficients Standard Error t Stat P-value 0.7064 -0.0639 0.1695 -0.3770 Intercept 0.0000 R_S&P500 0.8139 0.0629 12.9294 Interpret the regression output
Problem 6 Part A.5 Consider the following...
Problem 6 Part A.5 Consider the following regression output for the Single Index Model where excess returns on Microsoft Corp (MSFT) index regressed on the excess returns for the S&P500 are RMSFT ()aMFTPrsSPTRS&PS00 ()+eFT (t) S&P500 Regression Statistics Multiple R 0.5764 R Square 0.3322 Adjusted R Square 0.3302 Standard Error 3.1156 Observations 338 Coefficients Standard Error t Stat P-value 0.7064 -0.0639 0.1695 -0.3770 Intercept 0.0000 R_S&P500 0.8139 0.0629 12.9294 Interpret the regression output
Problem 6 Part A.5 Consider the following...
Consider the two (excess return) index-model regression results for stocks A and B. The risk-free rate...
 Consider the two (excess return) index-model regression results
for stocks A and B. The risk-free rate over the
period was 7%, and the market’s average return was 14%. Performance
is measured using an index model regression on excess returns.
Consider the two excess return) index-model regression results for stocks A and B. The risk-free rate over the period was 7%, and the market's average return was 14%. Performance is measured using an index model regression on excess returns Stock A...
Consider the two (excess return) index-model regression results
for stocks A and B. The risk-free rate over the
period was 7%, and the market’s average return was 14%. Performance
is measured using an index model regression on excess returns.
Consider the two excess return) index-model regression results for stocks A and B. The risk-free rate over the period was 7%, and the market's average return was 14%. Performance is measured using an index model regression on excess returns Stock A...
Consider the two (excess return) index-model regression results for stocks A and B. The risk-free rate...
 Consider the two (excess return) index-model regression results for stocks A and B. The risk-free rate over the period was 4%, and the marker's average return was 11%. Performance is measured using an index model regression on excess returns Index model regression estimates R-square Residual standard deviation, (e) Standard deviation of excess returns Stock A 1% + 1.2M - rf) 2.683 12.15 23.4% Stock 8 2% + 0.8( - rf) 2.49 20.93 28.5% a. Calculate the following statistics for each...
please show work Consider the two (excess return) index-model regression results for stocks A and B....
 please show work
Consider the two (excess return) index-model regression results for stocks A and B. The risk-free rate over the period was 5%, and the market's average return was 12%. Performance is measured using an index model regression on excess returns. Index model regression estimates R-square Residual standard deviation, o(e) Standard deviation of excess returns Stock A 1% + 1.2 (rm -rf 0.599 10.7% 22% Stock B 2% + 0.8(rm -rf) 0.448 19.5% 25.7% a. Calculate the following statistics...
please show work
Consider the two (excess return) index-model regression results for stocks A and B. The risk-free rate over the period was 5%, and the market's average return was 12%. Performance is measured using an index model regression on excess returns. Index model regression estimates R-square Residual standard deviation, o(e) Standard deviation of excess returns Stock A 1% + 1.2 (rm -rf 0.599 10.7% 22% Stock B 2% + 0.8(rm -rf) 0.448 19.5% 25.7% a. Calculate the following statistics...
 The index model has been estimated from the excess returns for
stock A with the following results: RA = 12.00% + 1.20RM + eA σM =
24.00% σ(eA) = 15.00% What is the standard deviation of the return
for stock A?
The index model has been estimated from the excess returns for stock A with the following results: RA= 12.00% +1.20RM+ EA OM= 24.00% olea) = 15.00% What is the standard deviation of the return for stock A? (Round your...
The index model has been estimated from the excess returns for
stock A with the following results: RA = 12.00% + 1.20RM + eA σM =
24.00% σ(eA) = 15.00% What is the standard deviation of the return
for stock A?
The index model has been estimated from the excess returns for stock A with the following results: RA= 12.00% +1.20RM+ EA OM= 24.00% olea) = 15.00% What is the standard deviation of the return for stock A? (Round your...
 Consider the two (excess return) index-model regression results for stocks A and B. The risk-free rate over the period was 8%, and the market's average return was 16%. Performance is measured using an index model regression on excess returns. Stock 18 + 1.2 (ry - rp) 0.677 Index model regression estimates R-square Residual standard deviation, (e) Standard deviation of excess returns Stock B 28 +0.8(IN - rf) 0.487 20.88 28.30 126 23.38 a. Calculate the following statistics for each stock:...
 #05 A Saved Consider the two (excess return) index-model regression results for stocks A and B. The risk-free rate over the period was 5%, a market's average return was 14%. Performance is measured using an index model regression on excess returns. Index model regression estimates R-square Residual standard deviation, ole) Standard deviation of excess returns Stock A 1% + 1.2 (rm -rf) 0.611 10.9% 22.2% Stock B 2% + 0.8(rm -rf) 0.454 19.7% 26.1% a. Calculate the following statistics for...
 Problem 6 Part A.5 Consider the following regression output for the Single Index Model where excess returns on Microsoft Corp (MSFT) index regressed on the excess returns for the S&P500 are RMSFT ()aMFTPrsSPTRS&PS00 ()+eFT (t) S&P500 Regression Statistics Multiple R 0.5764 R Square 0.3322 Adjusted R Square 0.3302 Standard Error 3.1156 Observations 338 Coefficients Standard Error t Stat P-value 0.7064 -0.0639 0.1695 -0.3770 Intercept 0.0000 R_S&P500 0.8139 0.0629 12.9294 Interpret the regression output
Problem 6 Part A.5 Consider the following...
Problem 6 Part A.5 Consider the following regression output for the Single Index Model where excess returns on Microsoft Corp (MSFT) index regressed on the excess returns for the S&P500 are RMSFT ()aMFTPrsSPTRS&PS00 ()+eFT (t) S&P500 Regression Statistics Multiple R 0.5764 R Square 0.3322 Adjusted R Square 0.3302 Standard Error 3.1156 Observations 338 Coefficients Standard Error t Stat P-value 0.7064 -0.0639 0.1695 -0.3770 Intercept 0.0000 R_S&P500 0.8139 0.0629 12.9294 Interpret the regression output
Problem 6 Part A.5 Consider the following...
 Consider the two (excess return) index-model regression results
for stocks A and B. The risk-free rate over the
period was 7%, and the market’s average return was 14%. Performance
is measured using an index model regression on excess returns.
Consider the two excess return) index-model regression results for stocks A and B. The risk-free rate over the period was 7%, and the market's average return was 14%. Performance is measured using an index model regression on excess returns Stock A...
Consider the two (excess return) index-model regression results
for stocks A and B. The risk-free rate over the
period was 7%, and the market’s average return was 14%. Performance
is measured using an index model regression on excess returns.
Consider the two excess return) index-model regression results for stocks A and B. The risk-free rate over the period was 7%, and the market's average return was 14%. Performance is measured using an index model regression on excess returns Stock A...
 Consider the two (excess return) index-model regression results for stocks A and B. The risk-free rate over the period was 4%, and the marker's average return was 11%. Performance is measured using an index model regression on excess returns Index model regression estimates R-square Residual standard deviation, (e) Standard deviation of excess returns Stock A 1% + 1.2M - rf) 2.683 12.15 23.4% Stock 8 2% + 0.8( - rf) 2.49 20.93 28.5% a. Calculate the following statistics for each...
 please show work
Consider the two (excess return) index-model regression results for stocks A and B. The risk-free rate over the period was 5%, and the market's average return was 12%. Performance is measured using an index model regression on excess returns. Index model regression estimates R-square Residual standard deviation, o(e) Standard deviation of excess returns Stock A 1% + 1.2 (rm -rf 0.599 10.7% 22% Stock B 2% + 0.8(rm -rf) 0.448 19.5% 25.7% a. Calculate the following statistics...
please show work
Consider the two (excess return) index-model regression results for stocks A and B. The risk-free rate over the period was 5%, and the market's average return was 12%. Performance is measured using an index model regression on excess returns. Index model regression estimates R-square Residual standard deviation, o(e) Standard deviation of excess returns Stock A 1% + 1.2 (rm -rf 0.599 10.7% 22% Stock B 2% + 0.8(rm -rf) 0.448 19.5% 25.7% a. Calculate the following statistics...
Most questions answered within 3 hours.
-
Where is the error in this code sequence?
String s1 = "Hello";
String s2 = "ello";...
asked 11 months ago -
Financial data for Joel de Paris, Inc., for last year
follow:
Joel de Paris, Inc.
Balance...
asked 11 months ago -
Consider this reaction:
Al2(SO4)3 (aq)+ BaCl3
(aq) Al2Cl6 (aq)- +
3BaSO4(s) . What is the...
asked 11 months ago -
Suppose that Savneet is considering increasing her
recent random sample from 20 car rentals to 40...
asked 11 months ago -
Trucks arrive at an unloading terminal at an average rate of 120
per hour.
Trucks arrive...
asked 11 months ago -
Why are methanol and ethanol completely soluble in water while
octanol is not very little soluble....
asked 11 months ago -
A facilities manager at a university reads in a research report
that the mean amount of...
asked 11 months ago -
When the CuSO4 is rehydrated by adding water to the anhydrous
compound, is this an endothermic...
asked 11 months ago -
A ray of sunlight is passing from diamond into crown glass; the
angle of incidence is...
asked 11 months ago -
A block of mass 0.249 kg is placed on top of a light, vertical
spring of...
asked 11 months ago -
how do the kidneys compensate in the presences of acidosis
a) trigger hyperventilate
b) reserve acid...
asked 11 months ago -
Question 501 pts
The rental rate of capital to the firm increases. Which of the
following...
asked 11 months ago