using two graphs, graphically illustrate the effect of an increase in income with the prices of...
using two graphs, graphically illustrate the effect of an increase in income with the prices of all goods fixed, with the first graph demonstrating how this causes consumers to alter their choice of market baskets for the consumption of food and clothing. Plot food on the horizontal axis and clothing on the vertical axis. Draw a second graph related to the first graph to demonstrate how the demand for food changes as income increases.
Homework Answers

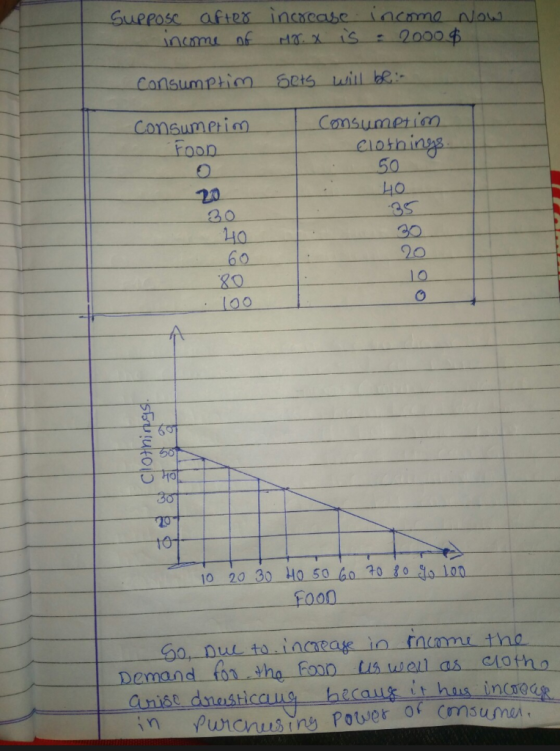
I have deliberately used ball pen to draw diagram instead of pencil because it is more clearly visible with ball pen.
Add Answer to:
using two graphs, graphically illustrate the effect of
an increase in income with the prices of...
(9) An increase in income, with the prices of all goods fixed, causes consumers to alter...
 (9) An increase in income, with the prices of all goods fixed, causes consumers to alter the choice of market baskets. The following graph shows, hamburger, though a normal good between points A and B, becomes an inferior good when the income-consumption curve bends backward between B and C. Please draw the shifts of the demand curve for hamburger in response to the increases in income. (3 points) 15 L Steak (units per month) Income-Consumption Curve 30 5 Hamburger (units...
Suppose Cole buys food (X) and clothing (Y) with his income of $500 per month. The prices that Co...
Suppose Cole buys food (X) and clothing (Y) with his income of $500 per month. The prices that Cole faces in month one are $2 per unit of food and $4 per unit of clothing. His utility-maximizing choice is 100 food units and 75 clothing units. His preferences are convex. Now assume that in month two, Cole's income increases by 11% to $555, the price of food increases by 5% to $2.10, and the price of clothing increases by 15%...
2. (10%) In this question, you'll draw graphs similar to that of Figure 5.2 from the textbook. Feel free to use the...
 2. (10%) In this question, you'll draw graphs similar to that of Figure 5.2 from the textbook. Feel free to use the attached grid paper at the end of the problem set. When graphing, make sure you are showing the correct budget constraints and ordered pairs, don't just draw random lines. An individual consumes two goods, clothing and food. The information below shows how this individual changes his consumption bundle as income changes, ceteris paribus. a. Illustrate each of the...
1. John has $400 to spend on goods H and Z. The market prices of these...
1. John has $400 to spend on goods H and Z. The market prices of these two goods are PH = 10 and PZ = 20. a. what is the market rate of substitution between goods H and Z? b. Illustrate the consumer's opportunity set in a carefully labeled diagram. Place H on the vertical axis. c. Show how the consumer's opportunity set changes if income increases by $200. How does the $200 increase in income alter the market rate...
For full points, don'just write final answer down -- show key steps to getting ir 1....
 For full points, don'just write final answer down -- show key steps to getting ir 1. (chapter 4: demand) Imagine a representative consumer whose utility for food (,) and housing (,) can be represented by a Cobb-Douglas form. In a general way.graph a consumer's budget constraint and indifference curve given prices and and the budget 2. Replicate the graph from problem 1, but then additionally depict an increase in the commer's budget and how the optimal consumption budget would change...
12. What causes for a demand curve to shitft to right or to left? When do...
 12. What causes for a demand curve to shitft to right or to left? When do we move from one point to another on a demand curve, what causes it? 13. Demonstrate graphically how a horizontal summation of "individual demand curves" provides a "market demand curve." 14. Discuss the most important factors/variables that affect supply of goods and services 15. Explain the difference between moving on the same supply curve and shifting the curve to right or left. 16. Demonstrate...
3. A consumer lives for two periods. His income in period 1 is Y, and his...
 3. A consumer lives for two periods. His income in period 1 is Y, and his income in period 2 is Y.,. The consumer is free to lend and borrow at zero interest rate (r=0 and R=1+r=1). Y, = Y, = 10. (a) What is the price of consumption in period 1 in terms of consumption in period 2? (How many units of period 2 consumption must the consumer give up to get an additional unit of consumption in period...
Suppose the income elasticity of demand for food is 0.5 and the price elasticity of demand...
 Suppose the income elasticity of demand for food is 0.5 and the price elasticity of demand is -1.0. Suppose also that you spends $10,000 a year on food, the price of food is $2, and that your income is $25,000. Ifa sales tax on food caused the price of food to increase to $2.50, what would happen to her consumption of food (i.e. how many units of food does she consume)? (Hint: Because a large price change is involved, you...
uestion 1) 2 points .Suppose a person wants to allocate income () between two products H...
 uestion 1) 2 points .Suppose a person wants to allocate income () between two products H (on the horizontal axis) and S (on the vertical axis) are given: PH-1:Ps-8:1-100: a. Write the equation of the budget line b. Compute the horizontal intercept& write the interpretation of it c. Compute the vertical intercept& write the interpretation of it d. Compute the slope and write the interpretation of it Question 2) 2 points .Consider information in question 1 to be the baseline...
Rosie makes fudge using two ingredients, sugar and chocolate. She prefers to have more of both...
Rosie makes fudge using two ingredients, sugar and chocolate. She prefers to have more of both goods, but she also prefers similar quantities of each; otherwise the fudge is too sweet or too bitter. In fact, her preferences are given by the utility function U(S,C) = S 1/2 + C 1/2 . A. What is Rosie’s preference between the bundle (4,16) and (16,4)? (Note that the consumption bundle is (# units of sugar, # units of chocolate)). What is Rosie’s...
 (9) An increase in income, with the prices of all goods fixed, causes consumers to alter the choice of market baskets. The following graph shows, hamburger, though a normal good between points A and B, becomes an inferior good when the income-consumption curve bends backward between B and C. Please draw the shifts of the demand curve for hamburger in response to the increases in income. (3 points) 15 L Steak (units per month) Income-Consumption Curve 30 5 Hamburger (units...
 2. (10%) In this question, you'll draw graphs similar to that of Figure 5.2 from the textbook. Feel free to use the attached grid paper at the end of the problem set. When graphing, make sure you are showing the correct budget constraints and ordered pairs, don't just draw random lines. An individual consumes two goods, clothing and food. The information below shows how this individual changes his consumption bundle as income changes, ceteris paribus. a. Illustrate each of the...
 For full points, don'just write final answer down -- show key steps to getting ir 1. (chapter 4: demand) Imagine a representative consumer whose utility for food (,) and housing (,) can be represented by a Cobb-Douglas form. In a general way.graph a consumer's budget constraint and indifference curve given prices and and the budget 2. Replicate the graph from problem 1, but then additionally depict an increase in the commer's budget and how the optimal consumption budget would change...
 12. What causes for a demand curve to shitft to right or to left? When do we move from one point to another on a demand curve, what causes it? 13. Demonstrate graphically how a horizontal summation of "individual demand curves" provides a "market demand curve." 14. Discuss the most important factors/variables that affect supply of goods and services 15. Explain the difference between moving on the same supply curve and shifting the curve to right or left. 16. Demonstrate...
 3. A consumer lives for two periods. His income in period 1 is Y, and his income in period 2 is Y.,. The consumer is free to lend and borrow at zero interest rate (r=0 and R=1+r=1). Y, = Y, = 10. (a) What is the price of consumption in period 1 in terms of consumption in period 2? (How many units of period 2 consumption must the consumer give up to get an additional unit of consumption in period...
 Suppose the income elasticity of demand for food is 0.5 and the price elasticity of demand is -1.0. Suppose also that you spends $10,000 a year on food, the price of food is $2, and that your income is $25,000. Ifa sales tax on food caused the price of food to increase to $2.50, what would happen to her consumption of food (i.e. how many units of food does she consume)? (Hint: Because a large price change is involved, you...
 uestion 1) 2 points .Suppose a person wants to allocate income () between two products H (on the horizontal axis) and S (on the vertical axis) are given: PH-1:Ps-8:1-100: a. Write the equation of the budget line b. Compute the horizontal intercept& write the interpretation of it c. Compute the vertical intercept& write the interpretation of it d. Compute the slope and write the interpretation of it Question 2) 2 points .Consider information in question 1 to be the baseline...
Most questions answered within 3 hours.
-
Where is the error in this code sequence?
String s1 = "Hello";
String s2 = "ello";...
asked 10 months ago -
Financial data for Joel de Paris, Inc., for last year
follow:
Joel de Paris, Inc.
Balance...
asked 10 months ago -
Consider this reaction:
Al2(SO4)3 (aq)+ BaCl3
(aq) Al2Cl6 (aq)- +
3BaSO4(s) . What is the...
asked 10 months ago -
Suppose that Savneet is considering increasing her
recent random sample from 20 car rentals to 40...
asked 10 months ago -
Trucks arrive at an unloading terminal at an average rate of 120
per hour.
Trucks arrive...
asked 10 months ago -
Why are methanol and ethanol completely soluble in water while
octanol is not very little soluble....
asked 10 months ago -
A facilities manager at a university reads in a research report
that the mean amount of...
asked 10 months ago -
When the CuSO4 is rehydrated by adding water to the anhydrous
compound, is this an endothermic...
asked 10 months ago -
A ray of sunlight is passing from diamond into crown glass; the
angle of incidence is...
asked 10 months ago -
A block of mass 0.249 kg is placed on top of a light, vertical
spring of...
asked 10 months ago -
how do the kidneys compensate in the presences of acidosis
a) trigger hyperventilate
b) reserve acid...
asked 10 months ago -
Question 501 pts
The rental rate of capital to the firm increases. Which of the
following...
asked 10 months ago