Questions 10-14: based on the following sample data set that reports the number of boats shipped...
Questions 10-14: based on the following sample data set that reports the number of boats shipped per week by Ottertail Boats, Inc.
83, 115, 119, 120, 121, 122, 122, 126, 129,
130, 131, 132, 133, 134, 135, 135, 135, 190
10. The sample mean is
a. 130.55
b. 127.73
c. 128.44
d. 129.50
11. The sample variance is
a. 384.85
b. 363.47
c. 19.62
d. 19.06
12. The sample standard deviation is
a. 384.85
b. 363.47
c. 19.62
d. 19.06
13. Outlier(s) is(are)
a. None.
b. 83 and 190
c. 83
d. 190
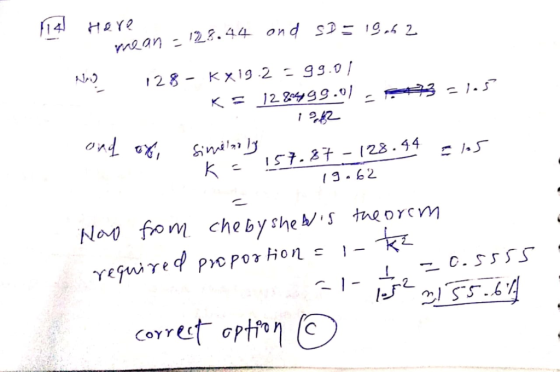
14. According to the Chebyshev's theorem, the proportion of data observations falling within (99.01, 157.87) is
a. About 75%
b. At least 55.6%
c. About 55.6%
d. At least 88.9%
Homework Answers
Here we have data:
83, 115, 119, 120, 121, 122, 122, 126, 129,
130, 131, 132, 133, 134, 135, 135, 135, 190
(11) sample mean(x-bar)="=AVERAGE(83, 115, 119, 120, 121, 122, 122, 126, 129,130, 131, 132, 133, 134, 135, 135, 135, 190)
=128.44
Correct option (C)
(11)Sample variance(s^2)="=VARA((83, 115, 119, 120, 121, 122, 122, 126, 129,130, 131, 132, 133, 134, 135, 135, 135, 190)
=384.85
Correct option (a)
(12) Sample standard deviation (s)="=STDEVA((83, 115, 119, 120, 121, 122, 122, 126, 129,130, 131, 132, 133, 134, 135, 135, 135, 190)=19.62
Correct option (c)
(13)

sample size: 18
Median: 129.5
Minimum: 83
Maximum: 190
First quartile: 120.75
Third quartile: 134.25
Interquartile Range: 13.5
Outliers: 83 190
Correct option (b)
(14)
Add Answer to:
Questions 10-14: based on the following sample
data set that reports the number of boats shipped...
Tomato weights and Fertilizer (Raw Data, Software Required): Carl the farmer has three fields of tomatoes,...
Tomato weights and Fertilizer (Raw Data, Software Required): Carl the farmer has three fields of tomatoes, on one he used no fertilizer, in another he used organic fertilizer, and the third he used a chemical fertilizer. He wants to see if there is a difference in the mean weights of tomatoes from the different fields. The sample data for tomato-weights in grams is given below. Carl claims there is a difference in the mean weight for all tomatoes between the...
THE NEXT QUESTIONS ARE BASED ON THE FOLLOWING: The below sample data set shows the relationship...
THE NEXT QUESTIONS ARE BASED ON THE FOLLOWING: The below sample data set shows the relationship between two variables. x y 10 8.04 8 6.95 13 7.58 9 8.81 11 8.33 14 9.96 6 7.23 4 4.26 12 10.84 1. Calculate the value of SSE. The Sum of Squares Error (SSE) es defined as; SSE A. 0.010 B. 28.53 C. 10.48 D. 18.05 2.Compute the value of the coefficient of determination: A. 2.67 B. 0.63 C. 0.80 D. 3.47 3.The...
data: (copy and paste in excel to view columns in alignment) Sample Repair Time (days) 1 ...
 data: (copy and paste in excel to view columns in alignment)
Sample Repair Time (days)
1 12
2 17
3 9
4 16
5 10
6 18
7 12
8 14
9 15
10 14
11 14
12 8
13 11
14 10
15 8
16 8
17 14
18 12
19 14
20 13
21 12
22 15
23 15
24 10
25 24
26 17
27 13
28 15
29 13
30 15
31 36
32 40
33 ...
data: (copy and paste in excel to view columns in alignment)
Sample Repair Time (days)
1 12
2 17
3 9
4 16
5 10
6 18
7 12
8 14
9 15
10 14
11 14
12 8
13 11
14 10
15 8
16 8
17 14
18 12
19 14
20 13
21 12
22 15
23 15
24 10
25 24
26 17
27 13
28 15
29 13
30 15
31 36
32 40
33 ...
Use Data Set D, Single Engine Aircraft Performance (Airplanes), on page 535 of your textbook to answer the following questions.
CruiseTotalHP1001162006002416501995701743001643601413601613001071101041451221601291801442301945701704202236202347501241801862851902851905001592351602351483101433001602001401252353501913101321251151801702101752441562001882801281601071251483001291801915001472352133501863001483001804401864401001501763001512609881163250143180Use Data Set D, Single Engine Aircraft Performance (Airplanes), on page 535 of your textbook to answer the following questions. The first column is X, or the independent variable and the second column is Y, or the dependent variable. Use MINITAB to obtain the simple regression equation, confidence interval, prediction interval, and required graphs. Insert tables and graphs in your report as appropriate. Use Minitab and produce the appropriate output to answer the following questions. Attach or include the Minitab...
For the data below** a. Make a scatterplot, where y=mortality and x= latitude. b. Find the...
 For the data below** a. Make a scatterplot, where y=mortality
and x= latitude.
b. Find the least-squares line relating mortality (y) to
latitude (x).
c. Plot the least-squares line on the graph from part a.
d. Is the slope positive or negative? Comment on what this
means.
Latitude Mortality 33.0 34.5 state 1. Alabama 2. Arizona 3. Arkansas 4. California 5. Colorado 6. Connecticut . DeLaware 8. Florida 9. Georgia 10. Idaho 11. Illinois 12. Indiana 13. Iowa 14. Kansas...
For the data below** a. Make a scatterplot, where y=mortality
and x= latitude.
b. Find the least-squares line relating mortality (y) to
latitude (x).
c. Plot the least-squares line on the graph from part a.
d. Is the slope positive or negative? Comment on what this
means.
Latitude Mortality 33.0 34.5 state 1. Alabama 2. Arizona 3. Arkansas 4. California 5. Colorado 6. Connecticut . DeLaware 8. Florida 9. Georgia 10. Idaho 11. Illinois 12. Indiana 13. Iowa 14. Kansas...
QUESTION 7 The data set Beer Large, which can be found in StatCrunch Shared Data Sets,...
 QUESTION 7 The data set Beer Large, which can be found in StatCrunch Shared Data Sets, gives the Alcohol, Carbohydrates and Calories for different brands of beer. The explanatory variable is x + Carbohydrates and the response variable is Y - Calories. Use this information to answer: Calculate the correlation between carbohydrates and calories. (4 decimal places) Row vars varo var var 8 var9 var 10 2 الميا ABV 4.1 5.4 4.43 4.13 5.9 4.9 Carbs 2.6 13.7 5.8 5...
1. Selling price in millions of shilling and size of homes Table Price Size Price Size &
1. Selling price in millions of shilling and size of homes Table Price Size Price Size Price Size (‘000) (sq. ft.) (‘000) (sq. ft.) (‘000) (sq. ft.) 268 1897 142 1329 83 1378 131 1157 107 1040 125 1668 112 1024 110 951 60 1248 112 935 187 1628 85 1229 122 1236 94 816 117 1308 128 1248 99 1060 57 892 158 1620 78 800 110 1981 135 1124 56 492 127 1098 146 1248 70 792 119 ...
Your IT department provided you data on patients that received ER services, their GHHS, and their recovery time. Prepare a report to share with the owners of the facility that will help you make infor...
Your IT department provided you data on patients that received ER services, their GHHS, and their recovery time. Prepare a report to share with the owners of the facility that will help you make informed decisions about how long you can expect a patients’ recovery time would be based on their GHHS. Based on your findings provide recommendations on your plan moving forward to improve the functioning of your facilities in generating revenue. Prepare a report that addresses each of...
Zippy, LLC has one employee who has worked January - June of the current year. The...
 Zippy, LLC has one employee who has worked January - June of the current year. The employee is single, paid weekly, and claims three allowances on her W-2. The company is in a state that has no state income taxes. The FICA Social Security tax rate is 6.2% on the first $118.500 of wages and the FICA Medicare tax rate is 1.45% on all wages. Zippy, LLCS FUTA tax rate is 0.6% on the first $7,000 of wages and their...
 data: (copy and paste in excel to view columns in alignment)
Sample Repair Time (days)
1 12
2 17
3 9
4 16
5 10
6 18
7 12
8 14
9 15
10 14
11 14
12 8
13 11
14 10
15 8
16 8
17 14
18 12
19 14
20 13
21 12
22 15
23 15
24 10
25 24
26 17
27 13
28 15
29 13
30 15
31 36
32 40
33 ...
data: (copy and paste in excel to view columns in alignment)
Sample Repair Time (days)
1 12
2 17
3 9
4 16
5 10
6 18
7 12
8 14
9 15
10 14
11 14
12 8
13 11
14 10
15 8
16 8
17 14
18 12
19 14
20 13
21 12
22 15
23 15
24 10
25 24
26 17
27 13
28 15
29 13
30 15
31 36
32 40
33 ...
 For the data below** a. Make a scatterplot, where y=mortality
and x= latitude.
b. Find the least-squares line relating mortality (y) to
latitude (x).
c. Plot the least-squares line on the graph from part a.
d. Is the slope positive or negative? Comment on what this
means.
Latitude Mortality 33.0 34.5 state 1. Alabama 2. Arizona 3. Arkansas 4. California 5. Colorado 6. Connecticut . DeLaware 8. Florida 9. Georgia 10. Idaho 11. Illinois 12. Indiana 13. Iowa 14. Kansas...
For the data below** a. Make a scatterplot, where y=mortality
and x= latitude.
b. Find the least-squares line relating mortality (y) to
latitude (x).
c. Plot the least-squares line on the graph from part a.
d. Is the slope positive or negative? Comment on what this
means.
Latitude Mortality 33.0 34.5 state 1. Alabama 2. Arizona 3. Arkansas 4. California 5. Colorado 6. Connecticut . DeLaware 8. Florida 9. Georgia 10. Idaho 11. Illinois 12. Indiana 13. Iowa 14. Kansas...
 QUESTION 7 The data set Beer Large, which can be found in StatCrunch Shared Data Sets, gives the Alcohol, Carbohydrates and Calories for different brands of beer. The explanatory variable is x + Carbohydrates and the response variable is Y - Calories. Use this information to answer: Calculate the correlation between carbohydrates and calories. (4 decimal places) Row vars varo var var 8 var9 var 10 2 الميا ABV 4.1 5.4 4.43 4.13 5.9 4.9 Carbs 2.6 13.7 5.8 5...
 Zippy, LLC has one employee who has worked January - June of the current year. The employee is single, paid weekly, and claims three allowances on her W-2. The company is in a state that has no state income taxes. The FICA Social Security tax rate is 6.2% on the first $118.500 of wages and the FICA Medicare tax rate is 1.45% on all wages. Zippy, LLCS FUTA tax rate is 0.6% on the first $7,000 of wages and their...
Most questions answered within 3 hours.
-
Where is the error in this code sequence?
String s1 = "Hello";
String s2 = "ello";...
asked 10 months ago -
Financial data for Joel de Paris, Inc., for last year
follow:
Joel de Paris, Inc.
Balance...
asked 10 months ago -
Consider this reaction:
Al2(SO4)3 (aq)+ BaCl3
(aq) Al2Cl6 (aq)- +
3BaSO4(s) . What is the...
asked 10 months ago -
Suppose that Savneet is considering increasing her
recent random sample from 20 car rentals to 40...
asked 10 months ago -
Trucks arrive at an unloading terminal at an average rate of 120
per hour.
Trucks arrive...
asked 10 months ago -
Why are methanol and ethanol completely soluble in water while
octanol is not very little soluble....
asked 10 months ago -
A facilities manager at a university reads in a research report
that the mean amount of...
asked 10 months ago -
When the CuSO4 is rehydrated by adding water to the anhydrous
compound, is this an endothermic...
asked 10 months ago -
A ray of sunlight is passing from diamond into crown glass; the
angle of incidence is...
asked 10 months ago -
A block of mass 0.249 kg is placed on top of a light, vertical
spring of...
asked 10 months ago -
how do the kidneys compensate in the presences of acidosis
a) trigger hyperventilate
b) reserve acid...
asked 10 months ago -
Question 501 pts
The rental rate of capital to the firm increases. Which of the
following...
asked 10 months ago