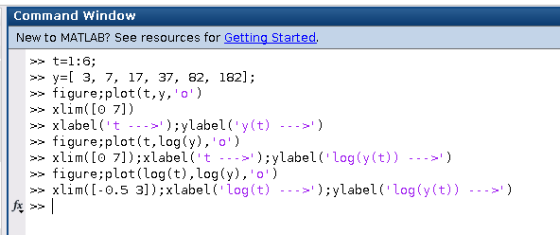
At times t = 1, 2, 3, 4, 5, and 6 seconds, data values yt =...
At times t = 1, 2, 3, 4, 5, and 6 seconds, data values yt = 3, 7, 17, 37, 82, and 182 are recorded. a.) Plot the data. (In MATLAB, after storing the t and y values in vectors, use plot(t,y,'o').) From this graph, do you think a linear, exponential, or power function is the best model for the data? b. Produce a semilog plot and use it to roughly estimate the growth rate k for a model of the data given by a curve of the form y = aekt . (In MATLAB, plot(t,log(y),'o') will produce the plot.) c. Produce a log–log plot and use it to roughly estimate the degree n of a power function, for a model of the data of the form y = at n. (In MATLAB, plot(log(t), log(y),'o') will produce the plot.)
Homework Answers

From the above plot it looks like an exponential function is the best model for the data.
Exponential model:
y=aekt
 log(y)
= log(a) + kt
log(y)
= log(a) + kt

if Y=log(y) and A=log(a)
Equation of straight line of above plot:


A=0.3170
a= e0.3170 = 1.373
And k=0.8145
y=1.373e0.8145t
Power function model:
y=atn
log(y) = log(a) + nlog(t)
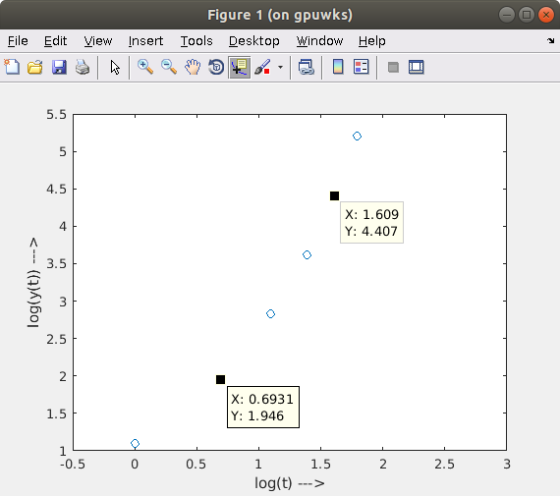
if T=log(t), Y=log(y) and A=log(a)
Equation of straight line of above plot:
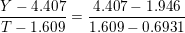


Approximate value of n=round(2.6870)=3
The accompanying data file contains 20 observations for t and yt. Actual series are plotted along with the superimposed linear and exponential trends. t y t y t y t y 1 1.91 6 4.93...
 The accompanying data file contains 20 observations for
t and yt.
Actual series are plotted along with the superimposed linear and
exponential trends.
t
y
t
y
t
y
t
y
1
1.91
6
4.93
11
5.96
16
15.58
2
3.57
7
6.78
12
9.02
17
12.33
3
5.83
8
4.58
13
9.52
18
13.95
4
5.39
9
7.19
14
14.02
19
15.63
5
2.78
10
8.81
15
14.57
20
19.77
The accompanying data file contains 20 observations for tand...
The accompanying data file contains 20 observations for
t and yt.
Actual series are plotted along with the superimposed linear and
exponential trends.
t
y
t
y
t
y
t
y
1
1.91
6
4.93
11
5.96
16
15.58
2
3.57
7
6.78
12
9.02
17
12.33
3
5.83
8
4.58
13
9.52
18
13.95
4
5.39
9
7.19
14
14.02
19
15.63
5
2.78
10
8.81
15
14.57
20
19.77
The accompanying data file contains 20 observations for tand...
Suppose the data consist of repeated observations (yt,X), t = 1,-.. ,T, for each in- dividual...
 Suppose the data consist of repeated observations (yt,X), t = 1,-.. ,T, for each in- dividual i 1,.. , n. Here yit is the response and xjt is a covariate vector. A linear mixed-effects model for analysing the population-averaged and subject-specific effects of Xit is of the following form ZiBWibi Ei, Уi (yil ,yiT)T; Zi is a T x p design matrix built from {xjt} for the fixed are i.i.d. MVN(0, Q) > 0 where y effects B; Wi is...
Consider the following time series data. t 1 2 3 4 5 Yt 6 12 9...
Consider the following time series data. t 1 2 3 4 5 Yt 6 12 9 14 16 a. Which of the following is a correct time series plot for this data? time series plot #1 time series plot #2 time series plot #3 1. 2. 3. What type of pattern exists in the data? linear trend curvilinear trend horizontal b. Develop the linear trend equation for this time series (to 1 decimal). Tt = ___ + ____t c. What...
I really need your help to answer this question for Tables 1 - 5. Thank you...
 I really need your help to answer this question for Tables 1 -
5. Thank you so much I appreciate it!!!
For each set of values, determine whether an exponential
function is a good model. If so, find the function. If not, explain
why.
Part C-Linear and Exponential Models (possible 15 points) You can transform an exponential function into a linear function by taking the logarithm of each side. Since linear models are easy to recognize, you can then determine...
I really need your help to answer this question for Tables 1 -
5. Thank you so much I appreciate it!!!
For each set of values, determine whether an exponential
function is a good model. If so, find the function. If not, explain
why.
Part C-Linear and Exponential Models (possible 15 points) You can transform an exponential function into a linear function by taking the logarithm of each side. Since linear models are easy to recognize, you can then determine...
Linear Algebra To fit data to an exponential model like y = AeKt, we first use...
 Linear Algebra
To fit data to an exponential model like y = AeKt, we first use a logarithm to linearize it: . n y n A k t Since A is a constant, so is ln A, and we can write this generically as ln y = co + cit. The table below shows the years different planes were first produced, along with how many displays (gauges, screens, etc.) were present in the cockpit. Year Introduced, y (Year after 1900)...
Linear Algebra
To fit data to an exponential model like y = AeKt, we first use a logarithm to linearize it: . n y n A k t Since A is a constant, so is ln A, and we can write this generically as ln y = co + cit. The table below shows the years different planes were first produced, along with how many displays (gauges, screens, etc.) were present in the cockpit. Year Introduced, y (Year after 1900)...
use Matlab y'=t, y0)=1, solution: y(t)=1+t/2 y' = 2(1 +1)y, y(0)=1, solution: y(t) = +24 v=5"y,...
 use Matlab
y'=t, y0)=1, solution: y(t)=1+t/2 y' = 2(1 +1)y, y(0)=1, solution: y(t) = +24 v=5"y, y(0)=1, solution: y(t) = { y'=+/yº, y(0)=1, solution: y(t) = (31/4+1)1/3 For the IVPs above, make a log-log plot of the error of Runge-Kutta 4th order at t=1 as a function of h with h=0.1 x 2-k for 0 <k <5.
use Matlab
y'=t, y0)=1, solution: y(t)=1+t/2 y' = 2(1 +1)y, y(0)=1, solution: y(t) = +24 v=5"y, y(0)=1, solution: y(t) = { y'=+/yº, y(0)=1, solution: y(t) = (31/4+1)1/3 For the IVPs above, make a log-log plot of the error of Runge-Kutta 4th order at t=1 as a function of h with h=0.1 x 2-k for 0 <k <5.
Problem 2: Consider the following periodic signals x(t), a square wave, and yt), a saw tooth...
 Problem 2: Consider the following periodic signals x(t), a square wave, and yt), a saw tooth 2T The pulses width of x(t) т, wave. Both have the same amplitude A and the same frequency - equal T. The duty-cycle of x(t) is defined as d- T. -A From tables of Fourier Series ofvarious periodic signals, the following formulas are given for your convenience x(= Ad+2Adnacos at+2Ad sna cos 2at+2Adl sun 3xdcos3at яd 2лd Зяd 24 (sin a 1 sin 2asin3ajain...
A valve on a storage tank is opened for 4 hours to release a chernical in a manufacturing process. The flow rate R (in liters per hours) at a time t (in hours) is given in the table. t0 1 2 3 4 RI 42...
 A valve on a storage tank is opened for 4 hours to release a chernical in a manufacturing process. The flow rate R (in liters per hours) at a time t (in hours) is given in the table. t0 1 2 3 4 RI 426 242|117|72 36 (a) Use the linear regression capabilities of a graphing utility to find a linear model for the points (t, In(R)). Write the resulting equation of the form In(R)a coetficients to four decimal places.)...
1. For the function (t) below, T 2 and Vm-100 V. vt) 3 2 012 3...
 1. For the function (t) below, T 2 and Vm-100 V. vt) 3 2 012 3 (a) Sketch v'(t) and derive the Fourier coefficients for '(t). (b) Use your results from part (a) to determine for Fourier coefficients for v(t). Express your solution in the complex form of the Fourier series, nugt and verify your solution by plotting your results using Matlab. 2. Assume that the signal above is the input to the bandpass filter shown below. y (t (a)...
solve part B Note: Do not use MATLAB (or other programming languages) build-in functions for regression....
 solve part B
Note: Do not use MATLAB (or other programming languages) build-in functions for regression. (a) Write a MATLAB (or other programming languages) function that accepts n values of xi and Yi, perform Linear Regression and returns values of rand, the model parameters ao and a. (6) Write another MATLAB (or other programming languages) function that accepts n values of X, and y(provided as arrays), checks for Linear, Power (y = axBx) and Saturation growth- rate (y = a*)...
solve part B
Note: Do not use MATLAB (or other programming languages) build-in functions for regression. (a) Write a MATLAB (or other programming languages) function that accepts n values of xi and Yi, perform Linear Regression and returns values of rand, the model parameters ao and a. (6) Write another MATLAB (or other programming languages) function that accepts n values of X, and y(provided as arrays), checks for Linear, Power (y = axBx) and Saturation growth- rate (y = a*)...
 The accompanying data file contains 20 observations for
t and yt.
Actual series are plotted along with the superimposed linear and
exponential trends.
t
y
t
y
t
y
t
y
1
1.91
6
4.93
11
5.96
16
15.58
2
3.57
7
6.78
12
9.02
17
12.33
3
5.83
8
4.58
13
9.52
18
13.95
4
5.39
9
7.19
14
14.02
19
15.63
5
2.78
10
8.81
15
14.57
20
19.77
The accompanying data file contains 20 observations for tand...
The accompanying data file contains 20 observations for
t and yt.
Actual series are plotted along with the superimposed linear and
exponential trends.
t
y
t
y
t
y
t
y
1
1.91
6
4.93
11
5.96
16
15.58
2
3.57
7
6.78
12
9.02
17
12.33
3
5.83
8
4.58
13
9.52
18
13.95
4
5.39
9
7.19
14
14.02
19
15.63
5
2.78
10
8.81
15
14.57
20
19.77
The accompanying data file contains 20 observations for tand...
 Suppose the data consist of repeated observations (yt,X), t = 1,-.. ,T, for each in- dividual i 1,.. , n. Here yit is the response and xjt is a covariate vector. A linear mixed-effects model for analysing the population-averaged and subject-specific effects of Xit is of the following form ZiBWibi Ei, Уi (yil ,yiT)T; Zi is a T x p design matrix built from {xjt} for the fixed are i.i.d. MVN(0, Q) > 0 where y effects B; Wi is...
 I really need your help to answer this question for Tables 1 -
5. Thank you so much I appreciate it!!!
For each set of values, determine whether an exponential
function is a good model. If so, find the function. If not, explain
why.
Part C-Linear and Exponential Models (possible 15 points) You can transform an exponential function into a linear function by taking the logarithm of each side. Since linear models are easy to recognize, you can then determine...
I really need your help to answer this question for Tables 1 -
5. Thank you so much I appreciate it!!!
For each set of values, determine whether an exponential
function is a good model. If so, find the function. If not, explain
why.
Part C-Linear and Exponential Models (possible 15 points) You can transform an exponential function into a linear function by taking the logarithm of each side. Since linear models are easy to recognize, you can then determine...
 Linear Algebra
To fit data to an exponential model like y = AeKt, we first use a logarithm to linearize it: . n y n A k t Since A is a constant, so is ln A, and we can write this generically as ln y = co + cit. The table below shows the years different planes were first produced, along with how many displays (gauges, screens, etc.) were present in the cockpit. Year Introduced, y (Year after 1900)...
Linear Algebra
To fit data to an exponential model like y = AeKt, we first use a logarithm to linearize it: . n y n A k t Since A is a constant, so is ln A, and we can write this generically as ln y = co + cit. The table below shows the years different planes were first produced, along with how many displays (gauges, screens, etc.) were present in the cockpit. Year Introduced, y (Year after 1900)...
 use Matlab
y'=t, y0)=1, solution: y(t)=1+t/2 y' = 2(1 +1)y, y(0)=1, solution: y(t) = +24 v=5"y, y(0)=1, solution: y(t) = { y'=+/yº, y(0)=1, solution: y(t) = (31/4+1)1/3 For the IVPs above, make a log-log plot of the error of Runge-Kutta 4th order at t=1 as a function of h with h=0.1 x 2-k for 0 <k <5.
use Matlab
y'=t, y0)=1, solution: y(t)=1+t/2 y' = 2(1 +1)y, y(0)=1, solution: y(t) = +24 v=5"y, y(0)=1, solution: y(t) = { y'=+/yº, y(0)=1, solution: y(t) = (31/4+1)1/3 For the IVPs above, make a log-log plot of the error of Runge-Kutta 4th order at t=1 as a function of h with h=0.1 x 2-k for 0 <k <5.
 Problem 2: Consider the following periodic signals x(t), a square wave, and yt), a saw tooth 2T The pulses width of x(t) т, wave. Both have the same amplitude A and the same frequency - equal T. The duty-cycle of x(t) is defined as d- T. -A From tables of Fourier Series ofvarious periodic signals, the following formulas are given for your convenience x(= Ad+2Adnacos at+2Ad sna cos 2at+2Adl sun 3xdcos3at яd 2лd Зяd 24 (sin a 1 sin 2asin3ajain...
 A valve on a storage tank is opened for 4 hours to release a chernical in a manufacturing process. The flow rate R (in liters per hours) at a time t (in hours) is given in the table. t0 1 2 3 4 RI 426 242|117|72 36 (a) Use the linear regression capabilities of a graphing utility to find a linear model for the points (t, In(R)). Write the resulting equation of the form In(R)a coetficients to four decimal places.)...
 1. For the function (t) below, T 2 and Vm-100 V. vt) 3 2 012 3 (a) Sketch v'(t) and derive the Fourier coefficients for '(t). (b) Use your results from part (a) to determine for Fourier coefficients for v(t). Express your solution in the complex form of the Fourier series, nugt and verify your solution by plotting your results using Matlab. 2. Assume that the signal above is the input to the bandpass filter shown below. y (t (a)...
 solve part B
Note: Do not use MATLAB (or other programming languages) build-in functions for regression. (a) Write a MATLAB (or other programming languages) function that accepts n values of xi and Yi, perform Linear Regression and returns values of rand, the model parameters ao and a. (6) Write another MATLAB (or other programming languages) function that accepts n values of X, and y(provided as arrays), checks for Linear, Power (y = axBx) and Saturation growth- rate (y = a*)...
solve part B
Note: Do not use MATLAB (or other programming languages) build-in functions for regression. (a) Write a MATLAB (or other programming languages) function that accepts n values of xi and Yi, perform Linear Regression and returns values of rand, the model parameters ao and a. (6) Write another MATLAB (or other programming languages) function that accepts n values of X, and y(provided as arrays), checks for Linear, Power (y = axBx) and Saturation growth- rate (y = a*)...
Most questions answered within 3 hours.
-
Where is the error in this code sequence?
String s1 = "Hello";
String s2 = "ello";...
asked 11 months ago -
Financial data for Joel de Paris, Inc., for last year
follow:
Joel de Paris, Inc.
Balance...
asked 11 months ago -
Consider this reaction:
Al2(SO4)3 (aq)+ BaCl3
(aq) Al2Cl6 (aq)- +
3BaSO4(s) . What is the...
asked 11 months ago -
Suppose that Savneet is considering increasing her
recent random sample from 20 car rentals to 40...
asked 11 months ago -
Trucks arrive at an unloading terminal at an average rate of 120
per hour.
Trucks arrive...
asked 11 months ago -
Why are methanol and ethanol completely soluble in water while
octanol is not very little soluble....
asked 11 months ago -
A facilities manager at a university reads in a research report
that the mean amount of...
asked 11 months ago -
When the CuSO4 is rehydrated by adding water to the anhydrous
compound, is this an endothermic...
asked 11 months ago -
A ray of sunlight is passing from diamond into crown glass; the
angle of incidence is...
asked 11 months ago -
A block of mass 0.249 kg is placed on top of a light, vertical
spring of...
asked 11 months ago -
how do the kidneys compensate in the presences of acidosis
a) trigger hyperventilate
b) reserve acid...
asked 11 months ago -
Question 501 pts
The rental rate of capital to the firm increases. Which of the
following...
asked 11 months ago